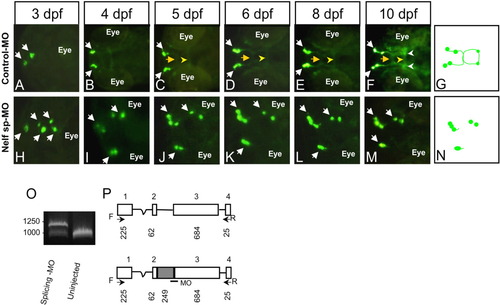
Representative time-lapse analysis of control-morpholino (MO) and Nelf-MO injected Tg(gnrh3:EGFP) larvae. A-F,H-M: Lateral (A,H) and dorsal (B-F,I-M) views of live larvae head, anterior is left. The injected MO and larvae age are as indicated. A-G: Normal GnRH3 phenotype. A: Bilateral expression of enhanced green fluorescent protein (EGFP) within GnRH3 neurons (white arrows) within the olfactory ephitelium-olfactory bulb boundary. B-F: GnRH3 somata in the telencephalon and projections extend and intersect at the anterior commissure (yellow arrow) and at the optic chiasm (yellow arrowhead). F: The GnRH3 neurons are seen along the GnRH3 axonal pathway and in the hypothalamus (white arrowheads). G: Schematic illustration of GnRH3 cells and projections as shown in F. H-N: Abnormal GnRH3 phenotype. H: Random dispersion of an excess number of GnRH3 neurons in the olfactory area. I-M: GnRH3 projections are absent. The migration of GnRH3 somata is unilateral and does not follow the normal GnRH3 axons outgrowth. The other GnRH3 cells cluster remains at the olfactory organ-olfactory bulb boundary. N: Schematic illustration of GnRH3 cells and projections as shown in M. O: Nelf[Int2Ex3]MO injection altered nelf mRNA splicing as shown by RT-PCR analysis of 1 dpf larvae. P: Sequence analysis indicates that Nelf[Int2Ex3]MO injection interfered with the splicing of exons 2 and 3, causing the addition of 249 nucleotides of intron 2. Upper and lower diagrams represent the cDNA of uninjected and Nelf[Int2Ex3]MO-injected embryos, respectively, as revealed by PCR using specific (arrows). Unfilled rectangles represent exons (lower numbers, bp; upper numbers, exon order), lines represent introns. The oblique lined rectangle represents the transcribed intron 2.
|
