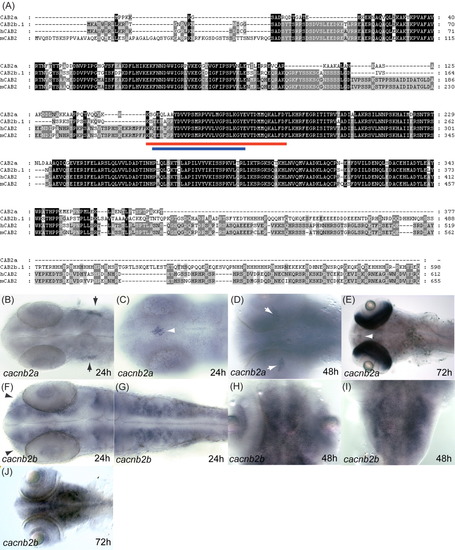
Zebrafish cacnb2a and cacnb2b genes. A: Alignment of proteins encoded by zebrafish and mammalian CACNB2 genes shows that they are highly homologous to each other. The red bar underlines the β interaction domain (BID). The blue bar underlines the deletion in the cacnb2b.2 variant. B: Ventral view of the head region showing that cacnb2a is expressed in the trigeminal ganglion (arrows) at 24 hours post fertilization (hpf). C: View of the dorsal surface of the brain showing expression of cacnb2a in the epiphysis at 24 hpf. D: View of ventral surface of the brain showing strong expression of cacnb2a along the optic stalks (white arrows) and weaker expression in the brain at 48 hpf. E: Dorsal view of head region of a 72 hpf embryo showing expression of cacnb2a in the epiphysis (white arrowhead) and in the retina. F: Dorsal view showing that cacnb2b is expressed in the brain and olfactory placodes (arrowheads) at 24 hpf. G: Dorsal view showing that cacnb2b is expressed in the hindbrain and spinal cord at 24 hpf. H: Dorsal view showing that cacnb2b is strongly expressed in the brain and the retina at 48 hpf. I: Dorsal view showing that cacnb2b is expressed in the hindbrain at 48 hpf. J: Dorsal view of 72 hpf embyro showing strong cacnb2b expression in the brain. Anterior is left in all the panels except (H-I).
|
