
Fig. 6
- ID
- ZDB-FIG-081104-13
- Publication
- Jarinova et al., 2008 - Functional resolution of duplicated hoxb5 genes in teleosts
- Other Figures
- All Figure Page
- Back to All Figure Page
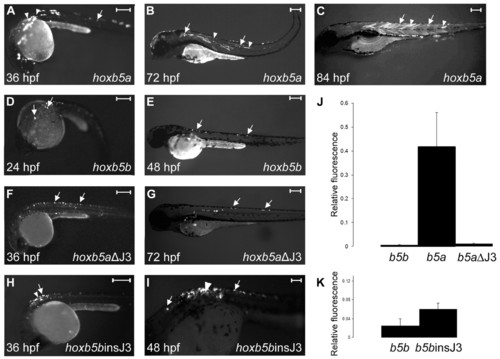
Expression of EGFP reporter transgenes in zebrafish embryos. (A-I) Lateral views (anterior to the left) of primary transgenic zebrafish embryos injected with (A-C) hoxb5aEGFP, (D,E) hoxb5bEGFP, (F,G) hoxb5aΔJ3EGFP or (H,I) hoxb5binsJ3EGFP. Developmental stages are indicated. Arrows indicate cells of the developing nervous system; arrowheads mark somites and muscle cells. Approximately 60% of the embryos injected with hoxb5bEGFP and 50% of embryos injected with hoxb5binsJ3EGFP showed EGFP expression, as compared with only 30% of hoxb5bEGFP and 37.5% of hoxb5aΔJ3EGFP embryos. Scale bars: 250 μm. (J,K) Relative copy numbers of EGFP transcripts detected by RT-PCR in primary transgenic embryos injected with hoxb5aEGFP (b5a), hoxb5bEGFP (b5b), hoxb5aΔJ3EGFP (b5aΔJ3) or hoxb5binsJ3EGFP (b5binsJ3) constructs. Column heights represent relative copy numbers of EGFP transcripts after normalization to endogenous hoxb5a expression. Each bar represents the average of three groups of transgenic embryos and error bars indicate s.e.m. |