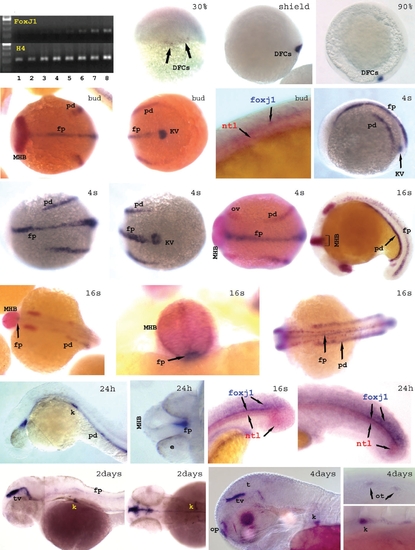
Expression pattern of foxj1. (A) RT-PCR expression analysis of zebrafish foxj1 and histone 4 (H4) as control was performed for different stages (1-8: unfertilized eggs, 100-200 cells, high-dome, 40-50% epiboly, 80-90%, bud, 6- somites, and 24h embryos, respectively). (B-W) Spatio-temporal expression pattern of zebrafish foxj1. Whole-mount in situ hybridization with zebrafish foxj1 probe alone (B-D, H-J, P-Q, TW), or combined with either pax2.1 (red) (E-F, KO) or ntl (red) (G, R-S). Stages are indicated at top right, with “s” referring to somite number, and hpf referring to hours post-fertilization. Views are as follows: (B) dorsal, (C,D) lateral with dorsal to the right, (E,I,K,M,O,U) dorsal with anterior to the left, (F,J) posterior with dorsal to the left, (Q) anterior with dorsal to the left, (G,H,L,P,R,S,T,V,W) lateral with anterior to the left, and (N) is posterior with dorsal up. DFCs, dorsal forerunner cells; e, eye; fp, floor plate; k, kidney; KV, Kupffer’s vesicle; MHB, mid-hindbrain boundary; op, olfactory pits; ot; otolith; ov, otic vesicle; pd, pronephric duct; t, tectum; tv, tectal ventricle.
|
