
Fig. 2
- ID
- ZDB-FIG-080708-21
- Publication
- Detrich et al., 1995 - Intraembryonic hematopoietic cell migration during vertebrate development
- Other Figures
- All Figure Page
- Back to All Figure Page
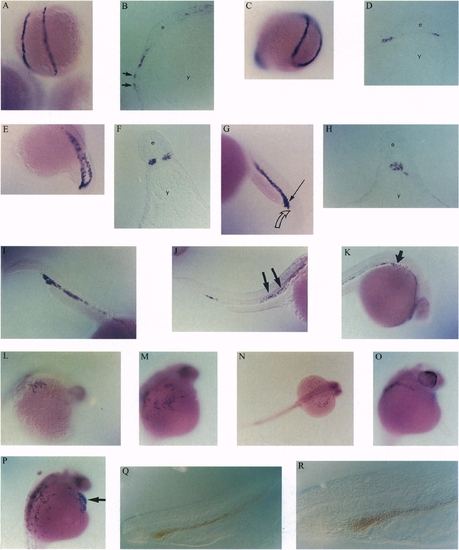
Expression of GATA-1 and globin during zebrafish embryogenesis. In situ hybridization was performed with fixed zebrafish embryos at the following stages: (A and B) Two somites. (C and D) Five somites. (E and F) Eighteen somites. (G and H) Twenty-three hours (before prim 5 stage). (I) Twenty-four hours (prim 5). (J) Twenty-five hours. (K) Twenty-six hours. (L-P) Twenty-six to 29 h. (B, D, F, and H) Cross-sections through the posterior region or tail bud (IM) of embryos corresponding to (A, C, E, and G). For each section, e denotes the embryo and y indicates the yolk. The arrows in B show GATA-1-expressing progenitors that reside in contact with the yolk syncytial layer. The closed arrow in G indicates the posterior boundary of GATA-1 expression in the IM. The open arrow in G points to undifferentiated, GATA-2-expressing progenitors in the posterior IM (see Fig. 3E). The arrows in J and K show hematopoietic progenitors migrating anteriorly and onto the yolk sac. Erythroid cells later enter the heart (P, arrow). [M, 0, and P are normal sibs from a cross of two spadetail (31) heterozygotes.] (Q and R) o-Dianisidine staining of 24-h wild-type zebrafish embryos. The brown color indicates erythroid cells containing hemoglobin in the IM region. |