
Fig. 5
- ID
- ZDB-FIG-080626-1
- Publication
- Balciunas et al., 2004 - Enhancer trapping in zebrafish using the Sleeping Beauty transposon
- Other Figures
- All Figure Page
- Back to All Figure Page
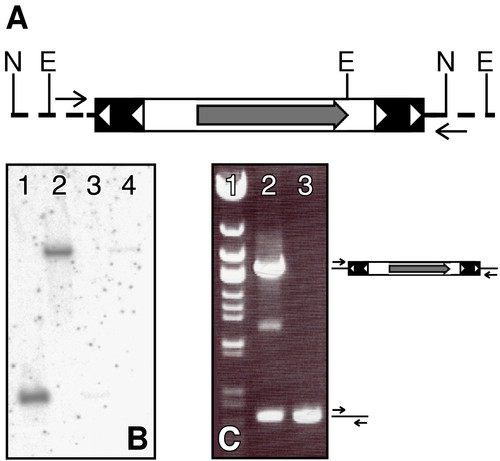
Identification of the transposition event in the ET2 line. (A) The pT2/S2EF1α transposon insertion into zebrafish genome is shown; restriction enzyme sites and primers used for molecular analysis are indicated. Transposon IR/DR's are shown as solid boxes with open triangles, and the GFP open reading frame is shown as a grey arrow. Genomic DNA is shown as a dotted line. N is NsiI, E is EcoRV. (B) Southern blot on ET2 line outcross embryos. DNA from GFP positive (lanes 1 and 2) and GFP negative (lanes 3 and 4) embryos was digested with NsiI (lanes 1 and 3) or EcoRV (lanes 2 and 4) and probed with a GFP-specific probe. (C) Linkage of the transposon insertion event to GFP expression. Primers flanking the transposon insertion event (arrows) were used to conduct PCR on DNA from GFP positive (lane 2) and GFP negative (lane 3) embryos from an ET2 outcross different from the one used in (B). Lane 1, λ Eco47III Marker (Fermentas Inc). |