
FIGURE
Fig. 4
- ID
- ZDB-FIG-080417-33
- Publication
- Ouyang et al., 2008 - A web based resource characterizing the zebrafish developmental profile of over 16,000 transcripts
- Other Figures
- All Figure Page
- Back to All Figure Page
Fig. 4
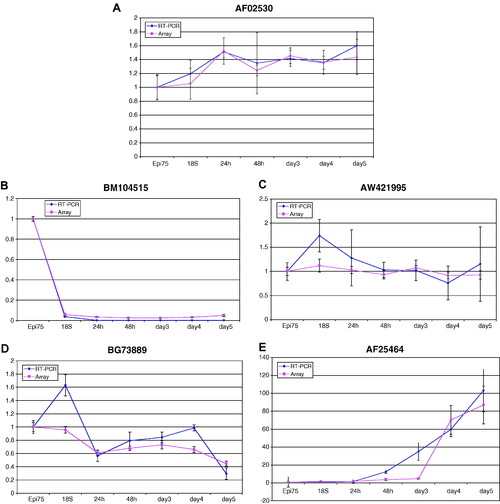
Comparison of array results with quantitative RT-PCR. Using the expression level of the 75% epiboly stage as reference, (A) the quantitative RT-PCR of β-actin (AF025305) at designated developmental stages have similar pattern to those obtained from the web resource which showed slightly increased expression after 24 hpf. The quantitative RT-PCR intensities for the selected (B) Node 2 gene (BM104515), (C) Node 3 gene (AW421995), (D) Node 4 gene (BG738899), and (E) Node 5 gene (AF254642) are closely correlated with the microarrary data. |
Expression Data
| Genes: | |
|---|---|
| Fish: | |
| Anatomical Term: | |
| Stage Range: | 75%-epiboly to Day 5 |
Expression Detail
Antibody Labeling
Phenotype Data
Phenotype Detail
Acknowledgments
This image is the copyrighted work of the attributed author or publisher, and
ZFIN has permission only to display this image to its users.
Additional permissions should be obtained from the applicable author or publisher of the image.
Reprinted from Gene expression patterns : GEP, 8(3), Ouyang, M., Garnett, A.T., Han, T.M., Hama, K., Lee, A., Deng, Y., Lee, N., Liu, H.Y., Amacher, S.L., Farber, S.A., and Ho, S.Y., A web based resource characterizing the zebrafish developmental profile of over 16,000 transcripts, 171-180, Copyright (2008) with permission from Elsevier. Full text @ Gene Expr. Patterns