|
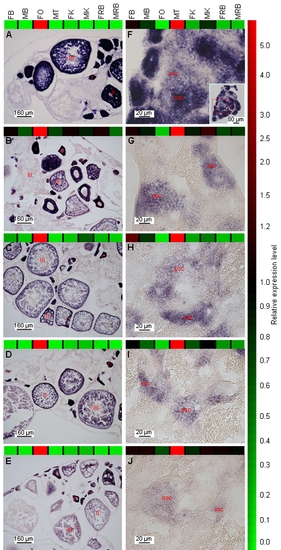
In situ hybridization revealed expression in the germline for ovary- and testis-enhanced genes.
Adult ovary (A–E) and adult testis (F–J) sections were hybridized with DIG-labeled riboprobes of ten genes which expressed strongly in either one of the gonads. Images are arranged from top to bottom in order of decreasing in situ hybridization signal intensity. Microarray expression levels for each gene across the eight organs analyzed are indicated by the coloured expression profiles. (A: zp2, B: btg4, C: CO350808, D: gez1, E: CO350303, F: gez2, G: sept4, H: CO353006, I: tekt1, J: MGC75611; I, II, III: stage I, II and III oocytes; psc: primary spermatocytes, ssc: secondary spermatocytes; FB, FO, FK and FRB represent the brain, ovary, kidney and ‘rest-of-body’ from female zebrafish, while MB, MT, MK and MRB represent the brain, testis, kidney and ‘rest-of-body’ from male zebrafish.)
|