
Fig. 9
- ID
- ZDB-FIG-080211-45
- Publication
- Tabor et al., 2008 - Pharmacological analysis of ionotropic glutamate receptor function in neuronal circuits of the zebrafish olfactory bulb
- Other Figures
- All Figure Page
- Back to All Figure Page
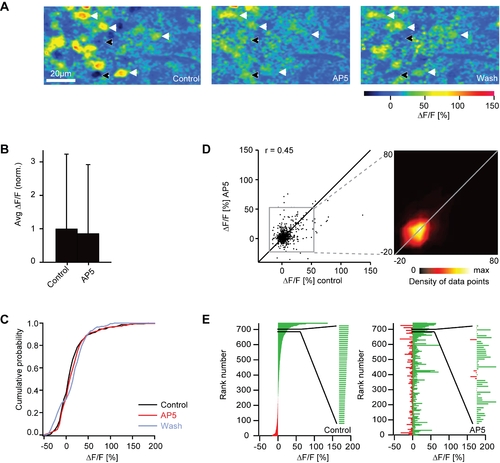
Effect of AP5 on mitral cell responses measured by 2-photon Ca2+ imaging. (A) Odor-evoked Ca2+ signals in mitral cells before, during and after application of AP5 (stimulus: food extract). Arrows depict somata of neurons identified as mitral cells by expression of the genetically encoded fluorescence marker HuC-YC. Black and white arrows show mitral cells whose response was increased and decreased, respectively, by AP5 treatment. (B) Average somatic Ca2+ signals before (control) and during application of AP5, normalized to control. Error bars show standard deviation. (C) Cumulative distribution of Ca2+ signal amplitudes before (black) and during application (red) of AP5 and after washout (gray). (D) Comparison of Ca2+ signal amplitudes evoked by the same odors in the same mitral cells before and during application of AP5. Data were pooled over all cells, odors and anminals (n = 742 responses). r, Pearson correlation coefficient. Inset shows the density of data points in the boxed region. Lines are diagonals with slope one. (E) Left: mitral cell odor responses ranked according to the Ca2+ signal before application of AP5. Inset shows an enlargement of a subregion. Right: Responses of the same mitral cells to the same odors in the presence of AP5, ranked in the same order as in the control. |