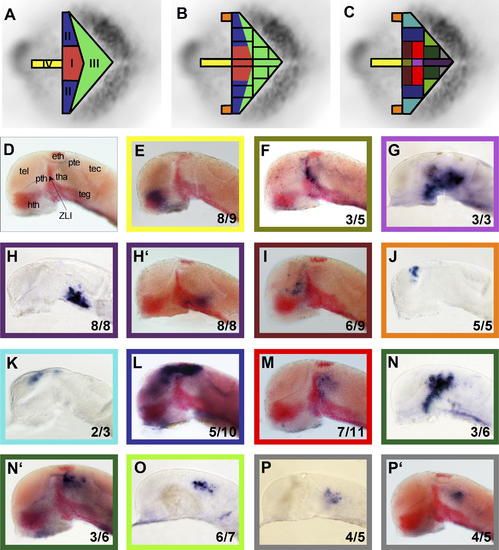
Fate of Caudal Forebrain Precursors (A) Schematic showing the four different diencephalic expression domains identified in Figure 1. (B) Arbitrary subdivision grid of the caudal forebrain shown on top of the expression domains plus an additional telencephalic subdomain (orange). (C) Colour code used for the final 12 domains investigated. Embryos in (D, E, F, H′, I, L, M, N′, and P′) show the expression of shh and otx5 in red. (D) Different areas of the rostral brain are labelled on an embryo showing expression of shh (in the ZLI) and otx5 (in the pineal gland) in red. (E) Cells of the bright yellow midline area are found in the hypothalamus. (F) Cells inside the lime midline domain populate the ventral ZLI. (G) The light violet area spans the posterior hypothalamus, the basal ZLI, posterior tuberculum, and some of the anterior tegmentum. (H and H′) Cells of the caudal-most midline domain of the forebrain are detected in the anterior tegmentum. (I) Cells labelled in the dark red domain of the neural plate contribute to the prethalamus. (J) Precursors of the orange area will populate the posterior dorsal-most telencephalon. (K) The light blue includes precursors of the dorsal telencephalon and the epithalamus. (L) The dark blue area marks cells of the dorsal telencephalon, epithalamus, and dorsal pretectum. (M) In the light red area, we found precursors of the thalamus. (N–P) (N and N′) Cells of the dark green domain can be found in the dorsal thalamus and, in some cases, in a stream of cells running down to the posterior hypothalamus (N2). Precursors of the light green area (O) populate parts of the pretectum and the tectum whereas cells of the grey area (P and P′) were detected in cells close to the midbrain. Because of the nature of the experiment (negative landmarks and fast developing embryos), we were not always reproducibly labelling the same cells in each experiment. Therefore, one can find, for each experiment, the number of embryos we labelled per experiment and how many of these result in the shown cell labelling. (For example 8/9 means eight out of nine embryos show the same labelling in the area depicted in the picture). eth, epithalamus + pineal gland; hth, hypothalamus; pte, pretectum; pth, prethalamus; tec, tectum; teg, tegmentum; tel, telencephalon; tha, thalamus.
|
