
FIGURE
Fig. 4
- ID
- ZDB-FIG-070822-54
- Publication
- Nakaya et al., 2007 - Expression patterns of alternative transcripts of the zebrafish olfactomedin 1 genes
- Other Figures
- All Figure Page
- Back to All Figure Page
Fig. 4
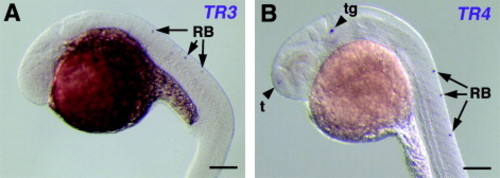
Expression pattern of the olfm1b gene from ectopically injected BAC DNA. One cell stage embryos were injected with 30 pg of olfm1b BAC DNA and analyzed by in situ hybridization for TR3 and TR4 expression. The signal of TR3 was only observed in Rohon-Beard neurons (RB) (A), while TR4 expression was detected mainly in the telencephalon (t), trigeminal ganglia (tg), and Rohon-Beard neurons (RB) (B). Scale bar, 0.1 mm. |
Expression Data
Expression Detail
Antibody Labeling
Phenotype Data
Phenotype Detail
Acknowledgments
This image is the copyrighted work of the attributed author or publisher, and
ZFIN has permission only to display this image to its users.
Additional permissions should be obtained from the applicable author or publisher of the image.
Reprinted from Gene expression patterns : GEP, 7(7), Nakaya, N., and Tomarev, S., Expression patterns of alternative transcripts of the zebrafish olfactomedin 1 genes, 723-729, Copyright (2007) with permission from Elsevier. Full text @ Gene Expr. Patterns