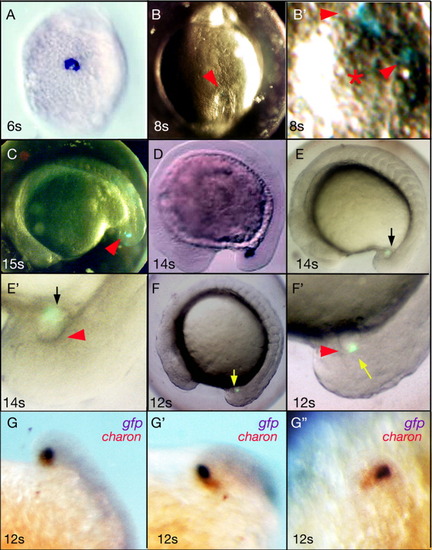
The chaTBE fragment drives KV expression of a GFP reporter. A,D: Endogenous charon expression. Reproduced from Hashimoto et al. ([2004]) with permission of the publisher. A: Six s embryo, vegetal view. D: Fourteen s, lateral view. Head to left. B, B′, C: Various views of the same pchaTBEd2eGFP-injected embryo. B: Eight s Bright field + fluorescence. Vegetal view. Red arrowhead points to Kupffer′s Vesicle (KV). B′: An enlarged image of the KV region of B. Red asterisk marks KV center. Red arrowheads point to d2eGFP-positive cells. C: Same embryo at 15 s. Head to left. Bright field + fluorescence. Red arrowhead: d2eGFP expression like cha (5D). E/E′, F/F′: Two pchaTBEd2eGFP-injected embryos from a separate experiment from that shown in B,C. Lateral view with superimposed bright field plus fluorescence. Yellow and black arrows: GFP fluorescence. Red arrowhead: KV. E: Fourteen-somite s. E′: Same embryo as in E. Enlarged view of tailbud/KV region. F: Twelve-somite s. F′: Same embryo as in F. Enlarged view of tailbud/KV region. G, G′, G′: Tailbud/KV region of a pchaTBEd2eGFP-injected embryo at 12 somites, shown in lateral, tilted, and dorsal views, respectively. Two-color RNA in situ with Dig-gfp and DNP-charon probes. In this embryo, the gfp (BM Purple) signal overlaps with the left half of the endogenous charon mRNA domain (INT Red/BCIP).
|
