
FIGURE
Fig. 3
- ID
- ZDB-FIG-070418-37
- Publication
- Bennett et al., 2007 - Nodal signaling activates differentiation genes during zebrafish gastrulation
- Other Figures
- All Figure Page
- Back to All Figure Page
Fig. 3
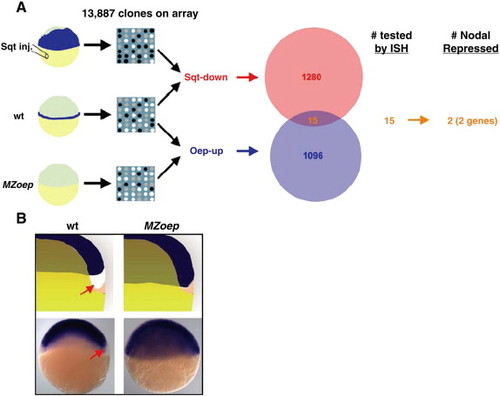
Identification of 2 Nodal-repressed genes. (A) The Venn diagram indicates the number of identified Sqt-down (red) and Oep-up (blue) clones. The overlap (orange) is indicated. Overlapping clones were screened by ISH. Two Nodal-repressed genes, sox2 and sox3, were identified. (B) Expression patterns of sox2 and sox3. The top two images are cartoon representations; the bottom two images are whole-mount ISH of sox3. Genotypes are indicated. Arrows indicate the region that lacks expression in wild type. |
Expression Data
Expression Detail
Antibody Labeling
Phenotype Data
Phenotype Detail
Acknowledgments
This image is the copyrighted work of the attributed author or publisher, and
ZFIN has permission only to display this image to its users.
Additional permissions should be obtained from the applicable author or publisher of the image.
Reprinted from Developmental Biology, 304(2), Bennett, J.T., Joubin, K., Cheng, S., Aanstad, P., Herwig, R., Clark, M., Lehrach, H., and Schier, A.F., Nodal signaling activates differentiation genes during zebrafish gastrulation, 525-540, Copyright (2007) with permission from Elsevier. Full text @ Dev. Biol.