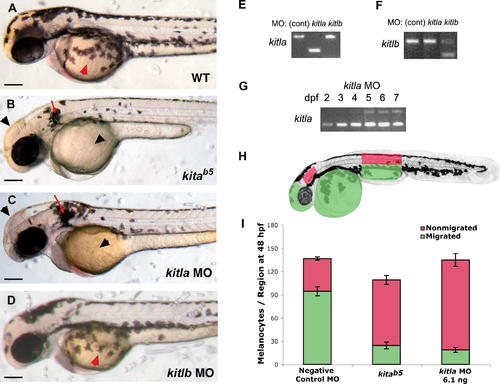
kitla Morphant Phenocopies kitab5 Migration (A) Wild-type embryonic pigment pattern at 2 dpf shows melanocytes migrating over the yolk (red arrowhead). (B) kitab5 mutants show migration phenotype, with melanocytes remaining near ear (red arrow) and dorsum and absent on yolk and head (black arrowheads). (C) Wild-type embryos injected with kitla MOs (6.1 ng) exhibit migratory phenotype similar to kitab5 with melanocytes present near the ear (red arrow) and absent at the head and yolk (black arrowheads). (D) Wild-type embryos injected with kitlb MOs (6.0 ng) are indistinguishable from wild-type showing melanocytes present over the yolk (red arrowhead) by 2 dpf. (E–G) RT-PCR of morphant embryos shows MO specificity: (E) kitla RT-PCR of wild-type, kitla MO, and kitlb MO at 3 dpf; (F) kitlb RT-PCR of wild-type, kitla MO, and kitlb MO at 3 dpf; and (G) kitla RT-PCR of kitla MO at 2, 3, 4, 5, 6, and 7 dpf, revealing that aberrant splice product caused by the MO is dominant until 5 dpf, when wild-type message is visible. (H) Regions in embryo that were used to define migrated and nonmigrated melanocytes for quantitative analysis of melanocyte migration. Red areas indicate nonmigrated melanocytes in the dorsal and lateral stripe above the hind yolk and behind the ear. Green areas define migrated melanocytes on the head, on the yolk, and in the ventral and yolk sac stripe of the hind yolk. Note that melanocytes that have migrated to positions between the dorsum and the horizontal myoseptum, a region with typically no melanocytes, would be scored as nonmigrated in the embryo, while any melanocyte that migrates past the horizontal myoseptum would be scored as migrated, whether its migration is appropriate or not. (I) Quantitative analysis for melanocyte migration of negative control MOs (6.8 ng), kitab5, and kitla MO (6.1 ng). kitla MO embryos display a similar loss of migration as kitab5. Mean values with 95% confidence interval are reported, n = 10. Scale bars: 150 μm.
|
