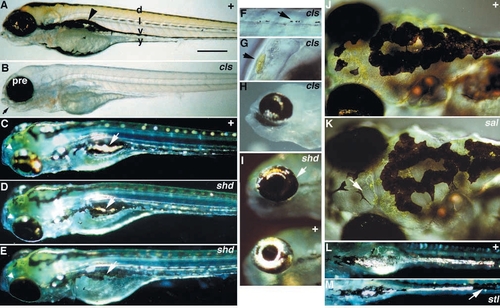
Sixth day phenotypes of decreased cell number (Classes I and II) mutants. Panels show wild-type control sibling together with homozygous individuals for each of cls (A,B,F-H), shd (C-E,I), sal (J,K) and snp (L,M). Chromatophores are prominent in wild-type larvae (four melanophore stripes are labelled, yellow xanthophore pigmentation is clear dorsally, and iridophores are just visible in the eye and the lateral patches (arrowhead)) (A), but absent in cls mutants (B). Note wild-type pigmented retinal epithelium and jaws and arches (arrow) in cls mutants. Occasional chromatophores found in cls include abnormally tiny melanophores (F), but normal xanthophores (G) and iridophores (H). shd mutants (D,E) have fewer iridophores, but where present they look normal. Iridophores in the lateral patches (arrow) and dorsal eye (arrowhead) are highlighted. shd alleles show a phenotypic series: shdty70 (D) is weaker than shdty82(E). An intermediate strength shd allele, shdtm46, shows iridophores over 30% of the outer eye (arrow, I). Ventral views of the yolk sac stripe in snp mutants (M) show gaps in the normally complete (compare L) stripe of iridophores (arrow). The continuous sheet of xanthophores shown in a dorsal view of the head (J) is interrupted in intermediate strength sal alleles (K) by cell-free areas which lack the characteristic granularity and yellow colour of xanthophores (arrow). C-E are dorsolateral views. C-E,I,L and M were photographed with incident light, H with a mix of incident and transmitted light. In this, and all subsequent figures, fish are oriented dorsal up, rostral left, and are photographed with transmitted light, unless otherwise noted. d, dorsal stripe; l, lateral stripe; pre, pigmented retinal epithelium; v, ventral stripe; y, yolk sac stripe. Scale bars, 400 μm (A-E), 75 μm (F), 150 μm (G), 325 μm (H), 250 μm (J,K) and 350 μm (L,M).
|
