
FIGURE
Fig. 5
- ID
- ZDB-FIG-060501-6
- Publication
- Miller-Bertoglio et al., 1997 - Differential regulation of chordin expression domains in mutant zebrafish
- Other Figures
- All Figure Page
- Back to All Figure Page
Fig. 5
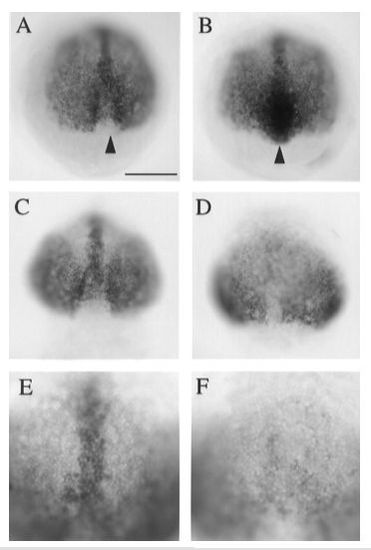
Domains of chordin expression are selectively affected in flh and spt mutants. (A, B) At 90% epiboly, chordin expression decreases in the posterior midline of WT embryos (A), but is increased in this region in flh mutants (B). (C – F) At 80% epiboly, chordin expression is not maintained in the axis of spt mutant embryos (D, F), compared to WT sibs (C, E). Scale bar 20 μm for A – D and 40 μm for E and F. |
Expression Data
| Gene: | |
|---|---|
| Fish: | |
| Anatomical Term: | |
| Stage Range: | 75%-epiboly to 90%-epiboly |
Expression Detail
Antibody Labeling
Phenotype Data
Phenotype Detail
Acknowledgments
This image is the copyrighted work of the attributed author or publisher, and
ZFIN has permission only to display this image to its users.
Additional permissions should be obtained from the applicable author or publisher of the image.
Reprinted from Developmental Biology, 192, Miller-Bertoglio, V.E., Fisher, S., Sanchez, A., Mullins, M.C., and Halpern, M., Differential regulation of chordin expression domains in mutant zebrafish, 537-550, Copyright (1997) with permission from Elsevier. Full text @ Dev. Biol.