
Fig. 1
- ID
- ZDB-FIG-060203-6
- Publication
- Her et al., 2006 - Imbalance in liver homeostasis leading to hyperplasia by overexpressing either one of the Bcl-2-related genes, zfBLP1 and zfMcl-1a
- Other Figures
- All Figure Page
- Back to All Figure Page
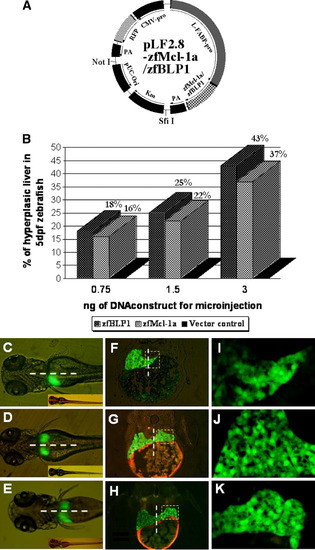
Liver hyperplasia at 5 days postfertilization (dpf) in zebrafish larvae overexpressing either zfMCl-1a or zfBLP1. A: Map of the dual-expression transgenic vectors, pLF2.8-zfBLP1 or zfMcl-1a, containing either zfMCl-1a or zfBLP1 in the same expression vector (pLF2.8). Either zfBLP1 or zfMcl-1a transgene and red fluorescent protein (RFP) marker are respectively driven by the L-FABP and CMV promoters. NotI- and SfiI-digested plasmids were injected into blastomeres at the one-cell stage. To estimate the levels of transgenic expression, an internal marker for monitoring the expression of the zfBLP1 or zfMcl-1a transgene was produced and RFP expression in injected fish was first assayed at 48 hours postfertilization (hpf), and then the different stages of embryonic and larval liver development were examined. B: Percentage of hyperplastic liver in 5 dpf zebrafish larvae overexpressing zfBLP1/zfMCl-1a. There were no significant differences between control zebrafish larvae and larvae overexpressing zfBLP1 or zfMCl-1a until 4-5 dpf. Significant instances of hyperplastic liver of zebrafish larvae overexpressing zfBLP1 or zfMCl-1a were observed after the 5 dpf stage. C-K: Comparison of liver phenotype between zebrafish larvae overexpressing zfBLP1 or zfMCl-1a and wild-type fish. C: The liver (arrowhead) in normal LF2.8-TG1 larvae is located to the left of the midline. D,E: The liver (arrowhead) in zebrafish larvae at 5 dpf overexpressing either zfMCl-1a (D) or zfBLP1 (E) was located symmetrically across the midline. Insets in C, D, and E show low-magnification images of whole LF2.8-TG1 larvae, demonstrating the absence of gross body abnormalities. F,H: Transverse sections through normal and hyperplastic liver larvae. The dorsal direction is toward the top, and the left side is toward the right. The normal liver is left of the midline in the section. G: The figures clearly show how the liver can be located symmetrically with respect to the midline in zebrafish larvae at 5 dpf when overexpressing either zfMCl-1a (G) or zfBLP1 (H). I-K: Higher-magnification images of green fluorescent protein (GFP) -labeled liver cells (hepatocytes) clearly showing normal cell morphology and density in the liver of normal larvae (I) and larvae overexpressing either zfMCl-1a (J) or zfBLP1 (K). |