
FIGURE
Fig. 3
- ID
- ZDB-FIG-050721-13
- Publication
- Zhao et al., 2005 - Characterization and expression pattern of two zebrafish atf7 genes
- Other Figures
- All Figure Page
- Back to All Figure Page
Fig. 3
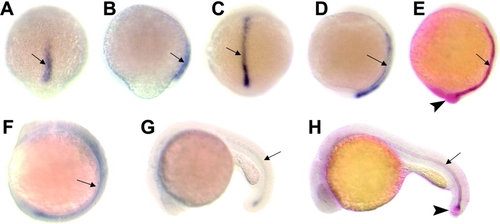
Spatiotemporal expression pattern of zebrafish atf7a. Distribution of endogenous mRNA was detected by whole-mount in situ hybridization. A,B: The 80% epiboly stage. C-E: The bud stage. F: The 10-somite stage. G,H: At 1 day. A,C: Dorsal views with animal pole to the top. B,D,E,F: Lateral views with animal pole or anterior to the top. E,H: Double staining with atf7a (blue) and ntl (red). Arrows indicate the notochord precursors or the notochord. E,H: Arrowheads indicate the germ ring (E) or tail bud (H) where only ntl is expressed. |
Expression Data
| Genes: | |
|---|---|
| Fish: | |
| Anatomical Terms: | |
| Stage Range: | 75%-epiboly to Prim-5 |
Expression Detail
Antibody Labeling
Phenotype Data
Phenotype Detail
Acknowledgments
This image is the copyrighted work of the attributed author or publisher, and
ZFIN has permission only to display this image to its users.
Additional permissions should be obtained from the applicable author or publisher of the image.
Full text @ Dev. Dyn.