
Fig. 2
- ID
- ZDB-FIG-050317-1
- Publication
- Kedinger et al., 2005 - Spatial and temporal distribution of the traf4 genes during zebrafish development
- Other Figures
- All Figure Page
- Back to All Figure Page
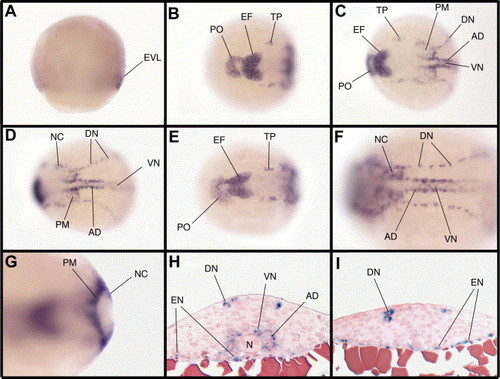
Expression of traf4a from the end of gastrulation to the beginning of somitogenesis. (A) traf4a is first detected weakly at 75% epiboly in the enveloping layer (EVL). (B) At the 3 somite stage, transcripts accumulate in the eye field (EF), the polster (PO), and in the trigeminal placode (TP). (C,D) More posterior views, expression of traf4a is detected in anterior trunkal neural crest (NC), the paraxial mesoderm (PM), the adaxial cells (AD), the dorsal and the ventral neurons (DN and VN). (E–G) similar expression is observed at 5 somite stage. (H,I) Histological transverse sections at the level of the adaxial cells and more posteriorly showing a presence of traf4a transcripts in the endoderm (EN). (A) lateral view, (B–F) dorsal views. In each panel, anterior is to the left. (G) optical cross-section at the level of the paraxial mesoderm. (H,I) histological transverse sections. N, notochord. |
| Gene: | |
|---|---|
| Fish: | |
| Anatomical Terms: | |
| Stage Range: | 1-4 somites to 5-9 somites |
Reprinted from Gene expression patterns : GEP, 5(4), Kedinger, V., Alpy, F., Tomasetto, C., Thisse, C., Thisse, B., and Rio, M.C., Spatial and temporal distribution of the traf4 genes during zebrafish development, 545-552, Copyright (2005) with permission from Elsevier. Full text @ Gene Expr. Patterns