
FIGURE
Fig. 4
- ID
- ZDB-FIG-050310-3
- Publication
- Rentzsch et al., 2003 - Specific and conserved roles of TAp73 during zebrafish development
- Other Figures
- All Figure Page
- Back to All Figure Page
Fig. 4
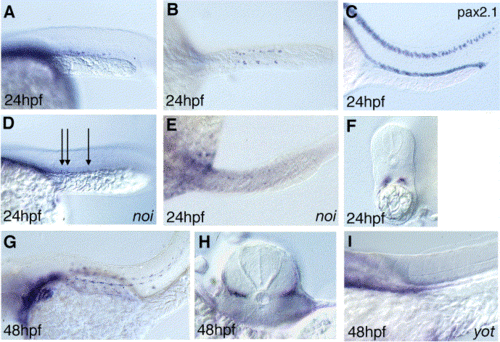
Expression of p73 in the pronephric duct (A–F) and slow muscles (G–I). (A, B, D–I) p73 expression, (C) pax2.1 expression; (A, C, D, G, I) lateral views on posterior trunk and tail region, anterior to the left, dorsal up; (B, E) are dorsal views of (A, D); (F) shows optical cross section of (B) at level of yolk extension; (H) shows optical cross section of (G) at trunk level. (D, E) pax2.1/noi mutant embryo, identified by the absence of the midbrain–hindbrain boundary. Arrows in (D) point to p73-positive cells in noi embryos. (I) yot mutant embryo, identified by its U-shaped somites. |
Expression Data
| Genes: | |
|---|---|
| Fish: | |
| Anatomical Terms: | |
| Stage Range: | Prim-5 to Long-pec |
Expression Detail
Antibody Labeling
Phenotype Data
Phenotype Detail
Acknowledgments
This image is the copyrighted work of the attributed author or publisher, and
ZFIN has permission only to display this image to its users.
Additional permissions should be obtained from the applicable author or publisher of the image.
Reprinted from Gene, 323, Rentzsch, F., Kramer, C., and Hammerschmidt, M., Specific and conserved roles of TAp73 during zebrafish development, 19-30, Copyright (2003) with permission from Elsevier. Full text @ Gene