
- Title
-
Developmental activation of the capability to undergo checkpoint-induced apoptosis in the early zebrafish embryo
- Authors
- Ikegami, R., Hunter, P., and Yager, T.D.
- Source
- Full text @ Dev. Biol.

The capabilities to undergo camptothecin-induced arrest of cell proliferation and apoptosis show different developmental time courses. Untreated control embryos were examined at a series of times, to estimate the baseline for cell number and mitotic index. At the shield stage (6 h postfertilization), a subset of embryos was treated with 60 μM camptothecin. Then, at subsequent times, both treated and untreated embryos were assayed for arrest of cell proliferation and for apoptosis. All assays were conducted in the flattened whole-mount format. (A) Example of 4-h-old control embryo, stained with Hoechst 33258 and examined under epifluorescence with a 10x (NA 0.5) objective. Scale bar = 100 μm. Higher power objectives were used to obtain a more detailed view of individual nuclei within such a mount. (B) Arrest of cell proliferation, assayed by counting the number of nuclei per microscopic field at different times after the start (↓) of camptothecin exposure. Open circles— untreated control embryos. Closed circles— embryos treated at 6 h with 60 μM camptothecin and then examined at successive times under a 40x (NA 0.75) objective. (C) Apoptosis, as revealed by estimating the number and percentage of fragmented nuclei per embryo. Exposure to 60 μM camptothecin began at 6 h postfertilization. Open circles—untreated control embryos. Closed circles—embryos treated at 6 h with 60 μM camptothecin and then examined at successive times under a 40x (NA 0.75) objective. At these time points, apoptotic cells were rare enough that every one in an embryo could be counted. Closed squares—embryos examined at 10, 11, and 12 h under a 100x (NA 1.30) oil-immersion objective. At these time points, apoptotic cells were so common that their numbers could be estimated by sampling replicate microscopic fields. In (C), error bars lie within the widths of the individual points. |
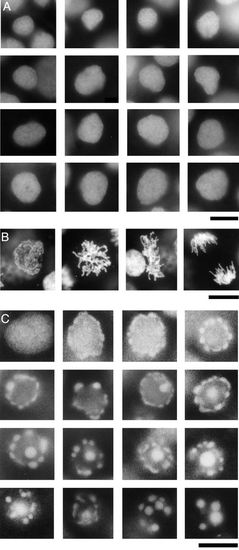
Fragmentation of cell nuclei in response to camptothecin treatment. (A) Interphase nuclei from the deep cell layer of an untreated control embryo. (B) Mitotic intermediates from the deep cell layer of an untreated control embryo. (C) Camptothecin-induced nuclear fragmentation in the deep cell layer. At 6 h postfertilization, embryos were treated with 60 μM camptothecin. At 9 h, the embryos were fixed and examined as flattened whole mounts. Successive images in (C) show progressive stages of fragmentation of individual cell nuclei from a single representative embryo, as revealed by staining with Hoechst 33258. All images were obtained with a 100x NA 1.30 (oil immersion) objective. Scale bars, 10 μm each. Spatial resolution in the (x,y) plane is estimated to be 500 ± 100 nm. For comparison, the Rayleigh limit for blue light at λ = 460 nm under an NA 1.3 objective is ∼180 nm (Slayter and Slayter, 1992). |
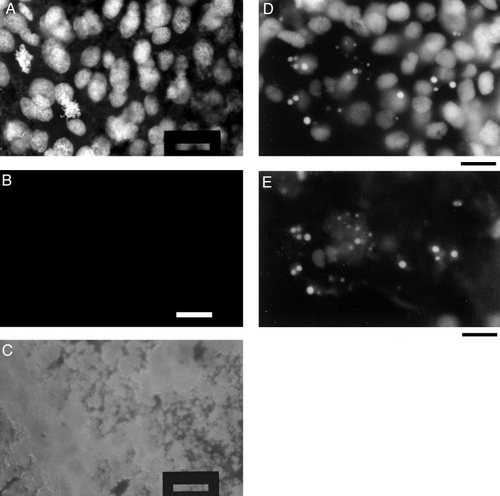
Camptothecin-induced DNA fragmentation as revealed by TUNEL assay. Embryos were exposed to 60 μM camptothecin at 6 h postfertilization. They were then assayed by TUNEL, counterstained with Hoechst 33258, and examined in the flattened whole-mount format. A positive TUNEL assay result, indicating the presence of DNA fragments labeled with digoxygenin–dUTP, was rendered visible with a Texas red-conjugated anti(digoxygenin) antibody. (A) Intact nuclei in untreated control embryo, under Hoechst 33258 counterstain. (B) Same microscopic field as in (A), viewed through Texas red filter set (for TUNEL readout). Same film exposure as in (A). (C) Sevenfold overexposed film image from (B), revealing a low-level, nonspecific background in the TUNEL assay. There is a very slight negative staining of some nuclei. (D) Nuclei from camptothecin-treated embryo, as revealed under Hoechst 33258 counterstain. (E) Same microscopic field as in (D), but viewed through Texas red filter set (for TUNEL readout). All images collected with a 100x (NA 1.30) oil-immersion objective. Scale bars, 20 μm each. |

Camptothecin-induced apoptosis involves cell-surface blebbing and is cell autonomous. Blastulae were dissociated to individual cells and cultured in a growth chamber. At a time corresponding to early gastrula stage in untreated control embryos, 60 μM camptothecin was added. Control cells from untreated blastulae were also maintained in a growth chamber. Periodically cells were fixed, stained with Hoechst 33258, and examined under both epifluorescence and phase-contrast microscopy using a 20x (NA 0.5) objective. A representative control cell is shown on the left, and a representative camptothecin-treated cell is shown on the right. Scale bars, 10 μm each. (A) Epifluorescence images of nuclei stained with Hoechst 33258. (B) Raw (8-bit gray scale) phase-contrast images. (C) Digital enhancement of (B). (D) Statistical analysis of spheroidal dark blebs in the enhanced images in (C). Left: digitized line profile across the diameter of a cell-surface bleb from a camptothecin-treated cell (. . .) and Gaussian least-squares fit (——). For a Gaussian curve, 95.5% of the integrated pixel intensity lies within ±2σ of the mean. The “width” of a bleb is defined as ±2σ in such a Gaussian fit. Right: cumulative distribution of widths of dark surface blebs, for untreated control cell (○) and camptothecin-treated cell (●). For the untreated cell, the mean bleb width was ≈2.2 μm. For the camptothecin-treated cell, the mean bleb width was ≈4.6 μm. |

Camptothecin-induced apoptosis produces a nucleosomal ladder. Embryos were treated with 60 μM camptothecin beginning at 6 h postfertilization. Then, at half-hour intervals between 7 and 12 h, subsets of the embryos were homogenized in high-EDTA buffer. Genomic DNA was extracted, run on a 1% agarose gel in TBE buffer, and transferred to a nylon membrane. After UV treatment, the membrane was hybridized with a randomly primed total zebrafish genomic DNA probe. Untreated control embryos of 7 and 12 h age (7.0C and 12.0C, respectively) were also processed in this way. (A) Phosphorimage of Southern blot. (B) Quantitation of phosphorimage. Mono-, di, tri-, tetra-, penta-, and hexanucleosomal DNA lengths are indicated. The nucleosomal repeat length in D. rerio is ∼185 bp. |

Dynamic behavior of nuclei in camptothecin-treated embryos, before the apoptotic phenotype is displayed. (A) Cumulative distribution of volumes of deep-layer nuclei. Embryos were treated with 60 μM camptothecin, beginning at 6 h postfertilization and continuing for the next 1, 2, 3, or 4 h. After treatment the embryos were fixed, stained with Hoechst 33258, converted into flattened whole mounts, and examined under a 100x (NA 1.30) oil immersion objective. The volumes of 150 deep-layer nuclei per embryo were estimated. The cumulative distribution of nuclear volumes is plotted for the different camptothecin treatment lengths and for untreated controls. (B) DNA synthesis in deep-layer nuclei. Embryos were exposed to 10 mM Br-dU and 60 μM camptothecin for 3 h, beginning at 6 h postfertilization. They were then processed for anti(Br-dU) immunohistochemistry and examined as flattened whole mounts. A gallery of photomicrographs of individual deep-layer nuclei, obtained with conventional epifluorescence microscopy, from a representative embryo is shown. Scale bar, 10 μm. (C) Confocal image of a single deep-layer nucleus from the camptothecin-treated embryo of (B). This image was collected on a Leica TCS4D confocal microscope, using an Omnichrome krypton–argon ion laser illumination source and a 100x (NA 1.4) oil immersion plan-apochromat objective. The 568-nm laser line was used for excitation, and a detector wavelength of 590 nm was selected by means of a dichroic filter. A series of confocal slices, each 20 nm thick and spaced 1 μm apart, was collected at 512 x 512-pixel resolution, with 8x line averaging. The image shown is a superimposition of eight consecutive slices. Scale bar, 3.3 μm. (D) DNA synthesis in EVL nuclei. A gallery of photomicrographs of individual EVL nuclei from a representative single embryo, under anti(Br-dU) staining and conventional epifluorescence microscopy, is shown. Scale bar, 10 μm. (E) DNA synthesis in YSL nuclei. A gallery of photomicrographs of individual YSL nuclei from a single representative embryo, under anti(Br-dU) staining and conventional epifluorescence microscopy, is shown. Scale bar, 10 μm. (F and G) Limit of optical resolution for images obtained from a flattened whole mount, using either conventional epifluorescence microscopy (F) or confocal fluorescence microscopy (G). In either case, a line profile was drawn across two neighboring (but separate) points of fluorescent light. The resultant plot of pixel intensity versus position along the line profile was fit to a pair of Gaussian functions, representing emission from a pair of point sources. Spacing between peak centers is 530 nm for the conventional epifluorescence image in F and 480 nm for confocal image in G. For comparison, the Rayleigh limit for 590-nm orange light under an NA 1.3 objective is ∼230 nm (Slayter and Slayter, 1992). |

Multiple effects of early treatment with camptothecin. (A) Survival curves for sets of embryos which were treated either transiently or chronically with 1, 10, or 60 μM camptothecin over different developmental stages. Transient treatments were ended by transfer of the embryos to water. Control embryos were exposed only to water. Treatments were as follows: (○) 60 μM over the 4- to 8-cell stage, () 1 μM over the 8- to 16-cell stage, (●) 10 μM over the 8- to 16-cell stage, () 60 μM over the 8- to 16-cell stage, (△) 1 μM over the early blastula stage, (◆) 10 μM over the early blastula stage, (■) 60 μM over the early blastula stage, (◇) 1 μM starting at late blastula stage, () 10 μM starting at late blastula stage, (■) 60 μM starting at late blastula stage, (▲) 1 μM starting at shield stage, (□) 60 μM starting at shield stage. Untreated control embryos displayed 100% survival over 12 h (data points for controls are coincident with the open squares □). (B) Gallery of nuclei with multipolar spindles, observed at 9 h in embryos which had been treated over the 8- to 16-cell stage with 60 μM camptothecin. (C) Gallery of apoptotic nuclei, observed at 9 h in embryos which had been treated over the 8- to 16-cell stage with 60 μM camptothecin. (D) Gallery of normal nuclei from untreated control embryo, examined at 9 h. (E) Defective mitotic figures, observed at 9 h in embryos which had been treated at early blastula stage with 1 μM camptothecin. (F) Micronuclei (arrowheads), observed at 9 h in embryos which had been treated at early blastula stage with 1 μM camptothecin. (G) Stretched nuclei, observe at 9 h in embryos which had been treated at early blastula stage with 1 μM camptothecin. Two extremely fine stretched fibers, emanating from a single nucleus, are indicated by arrowheads. (H) Apoptotic nuclei, observed at 9 h in embryos which had been treated at early blastula stage with 1 μM camptothecin. In B–H, embryos were examined as flattened whole mounts under a 100x (NA 1.30) oil-immersion objective. Scale bars, 10 μm each. |

Effects of early treatment with aphidicolin or hydroxyurea. (A) Survival curves for aphidicolin treatments. Sets of replicate embryos (N = 22–25) either were pulsed with aphidicolin and then transferred to water or were left in aphidicolin. The embryos were checked periodically for survival. Treatments: (●) 25 μg/ml chronic exposure, starting at 4- to 8-cell stage; (□) 0.5 μg/ml 1-h pulse over the 8- to 16-cell stage; (△) 5 μg/ml 1-h pulse over the 8- to 16-cell stage; (■) 25 μg/ml 1-h pulse over the 8- to 16-cell stage; (▲) 25 μg/ml chronic exposure, starting at 16- to 32-cell stage; (○) 25 μg/ml chronic exposure, starting at dome-sphere stage. The untreated control embryos display 100% survival through 12 h. (B) Survival curves for hydroxyurea treatments. Sets of replicate embryos either were pulsed with hydroxyurea and then transferred to water or were left in hydroxyurea. The embryos were checked periodically for survival. Treatments: (△) 130 mM 1-h pulse over the 4- to 8-cell stage; (●) 130 mM chronic exposure, starting at the 4- to 8-cell stage; (■) 0.1 mM chronic exposure, starting at the 4- to 8-cell stage; (▲) 10 mM chronic exposure, starting at the 4- to 8-cell stage; (□) 30 mM chronic exposure, starting at the 4- to 8-cell stage; (■) 30 mM chronic exposure, starting at late-blastula stage; (▲) 130 mM chronic exposure, starting at late-blastula stage; (○) untreated controls (100% survival over 12 h). (C) Inhibition of cell replication by aphidicolin and hydroxyurea. Left: number of nuclei per embryo, assayed at 8 h, for untreated controls (CON), for embryos treated chronically with 25 μg/ml aphidicolin starting at the 4- to 8-cell stage (A25), and for embryos treated transiently with 130 mM hydroxyurea over the 4- to 8-cell stage (H130). Right: number of nuclei per embryo, assayed at 11 h, for untreated controls (CON), for embryos treated chronically with 25 μg/ml aphidicolin starting at late-blastula stage (A25), and for embryos treated transiently with 130 mM hydroxyurea starting at late-blastula stage (H130). (D) Induction of apoptosis by aphidicolin and hydroxyurea. Left: percentage apoptotic nuclei assayed at 8 h, for untreated controls (CON), for embryos treated chronically with 25 μg/ml aphidicolin starting at the 4- to 8-cell stage (A25), and for embryos treated transiently with 130 mM hydroxyurea over the 4- to 8-cell stage (H130). Right: percentage apoptotic nuclei assayed at 11 h, for untreated controls (CON), for embryos treated chronically with 25 μg/ml aphidicolin starting at the late-blastula stage (A25), and for embryos treated transiently with 130 mM hydroxyurea over the late-blastula stage (H130). (E) Apoptotic nuclei, in embryo treated chronically with 25 μg/ml aphidicolin beginning at 4- to 8-cell stage and then examined at 9 h. (F) Apoptotic nuclei, in embryo treated chronically with 130 mM hydroxyurea beginning at 4- to 8-cell stage and then examined at 9 h. (G) High frequency of nuclei that display Hoechst-excluding central regions. These were produced by chronic treatment with 30 mM hydroxyurea beginning at late-blastula stage. Examination at 9 h. (H) Apoptotic nuclei, in embryo treated chronically with 130 mM hydroxyurea beginning at late-blastula stage. Examination at 9 h. In (E–H), embryos were examined as flattened whole mounts, using a 100x (NA 1.30) objective. Scale bars, 10 μm each. |

Precisely timed spontaneous death of fertilized but uncleaved zebrafish eggs. In two clutches of embryos, we found significant numbers of eggs which were fertilized but unable to cleave (N = 6 and N = 19 for the two experiments). These eggs were maintained in water and examined periodically. (A) Survival curves. (■) Clutch 1 (N = 19), (●) clutch 2 (N = 6), (○) untreated controls (N = 25). (B) Control embryo at 7.5 h (70% epiboly stage). (C) Fertilized but uncleaved eggs at 7.5 h, showing blebs on surface of single cell. The photomicrographs of (B and C) were obtained under bright-field illumination, using a 5x (NA 0.15) objective. Scale bar, 400 μm. |
Reprinted from Developmental Biology, 209, Ikegami, R., Hunter, P., and Yager, T.D., Developmental activation of the capability to undergo checkpoint-induced apoptosis in the early zebrafish embryo, 409-433, Copyright (1999) with permission from Elsevier. Full text @ Dev. Biol.