
- Title
-
Localized calcium signals in early zebrafish development
- Authors
- Reinhard, E., Yokoe, H., Niebling, K.R., Allbritton, N.L., Kuhn, M.A., and Meyer, T.
- Source
- Full text @ Dev. Biol.

Measurement of Ca2+ signals during blastula using a subtractive imaging method. Embryos were injected with Ca2+-green dextran at the one-cell stage. Fluorescence images of cross sections through embryos were taken every 10 sec. Rapid increases in local fluorescence intensity were measured by applying a subtraction algorithm to the same pixel value in subsequent images: s = γ(fn+1 - min[fn + 1, fn]) with δ as the resulting pixel intensity value, fn and fn + 1 being pixel intensity values from subsequent images, and γ being a contrast index (γ = 7 to 10). By using the minimum function (min[ ]), only the rising phase and not the falling phase of intensity changes is identified; if the fluorescence intensity at an image location stays equal or decreases (fn + 1 ≤ fn), the pixel value of the subtracted image is 0. (A) At the top left, a confocal fluorescence image of a side section from an embryo is shown 3 hr 30 min after fertilization at the beginning of the recording. The next 11 images are subtractive images during the following 100 sec. At the right top, a schematic view of the recording configuration is shown. A 20X objective was used. The scale bar is 50 μm. Six of the nine embryos recorded in this fashion developed normally for at least 48 hr (including the one show in Fig. 2A). (B) At the top left, a confocal fluorescence image of a cross section of a vertically placed embryo is shown 2 hr 50 min after fertilization when the recording began. The next five images are subtractive images during the following 40 sec. At the right top, a schematic view of the recording configuration is shown. A 10x objective was used. The scale bar is 100 μm. |

Measurement of Ca2+ signals during zebrafish blastula. Fluorescence intensity recordings were made by measuring the average fluorescence intensity at different locations (∼15 x 15 μm recording areas) as a function of time. (A) Confocal fluorescence image of the cross section used for the recordings in Fig. 3B. The six locations of the recordings are marked. The scale bar is 100 μm. (B) Recordings shown were made 3 hr after fertilization at six different locations in the same image plane near the animal pole. The traces show transient changes in fluorescence intensity reminiscent of IP3-mediated Ca2+ spikes in other cell types. |

Characterization of the in vivo properties of nuclear targeted Ca2+ indicator. This indicator was used to identify individual embryonic cells and to measure their Ca2+ signals during zebrafish development. A through D show fluorescence images of a developing zebrafish embryo injected with the Ca2+ indicator NuCa-green at the one-cell stage. (A) Fluorescence image of a confocal cross section through the nuclei of a four-cell embryo, 1 hr after fertilization. The embryo was positioned as shown in Fig. 2B. (B) The same cross section is shown 4 min later, shortly after nuclear localization of the indicator was lost. Diffusion of NuCa-green throughout the cytoplasm occurred within 30 sec of nuclear envelope breakdown. (C) The same cross section is shown 15 min later. NuCa-green was sequestered again into the newly formed nuclei of the eight-cell embryo. Using this method, nuclei can be identified for about 70% of the duration of each cell cycle during the rapidly dividing cleavage stage. The scale bars in A, B, and C are 100 μm. (D) A side section of the same embryo is shown during the midblastula stage at a higher magnification. The scale bar is 50 μm. (E) Nuclei migrate during development. The tracking of nuclei is shown during the 10-min interval during which the nuclei of a four-cell embryo were visible. The scale bar is 100 μm. |
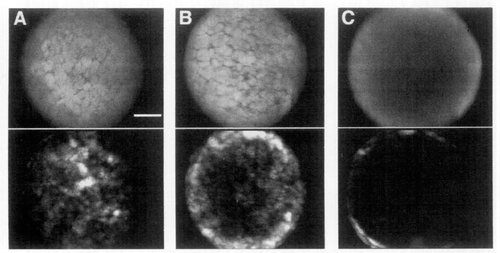
Analysis of the spatial symmetry of Ca2+ activity in the zebrafish blastula. Using subtractive image analysis of embryos injected with Ca2+-green dextran, Ca2+ activity was analyzed at different cross sections between the animal pole and the marginal blastomeres near the yolk cell. The top images are representative fluorescent images of cross sections containing the animal pole (A), the midsection (B), and the margin of blastula (C). The bottom images represent the sum of subtractive images each, recorded in early to midblastula. For each of the composite images in A and B, 450 images were taken. The interval between images was 10 sec and the recording switched between the section at the animal pole and the midsection every 150 images (recording was started 2 hr after fertilization). In C, 600 images were taken every 5 sec in the region of the marginal blastomeres starting at 2 hr 20 min after fertilization. The time interval of recording was only 50 min because the margin of the embryo did not remain in the same plane during longer recording intervals. Because the 10x objective had a low numerical aperture and because the recorded planes were far from the cover slip surface, the confocal sections were close to 80 μm thick. |
Reprinted from Developmental Biology, 170, Reinhard, E., Yokoe, H., Niebling, K.R., Allbritton, N.L., Kuhn, M.A., and Meyer, T., Localized calcium signals in early zebrafish development, 50-61, Copyright (1995) with permission from Elsevier. Full text @ Dev. Biol.