
- Title
-
Genetic compensation highlights the importance of neural cell adhesion molecule Ncam1 paralogs in balancing signaling pathways during zebrafish lateral line development
- Authors
- Lange, A., Bastmeyer, M., Bentrop, J.
- Source
- Full text @ Eur. J. Cell Biol.
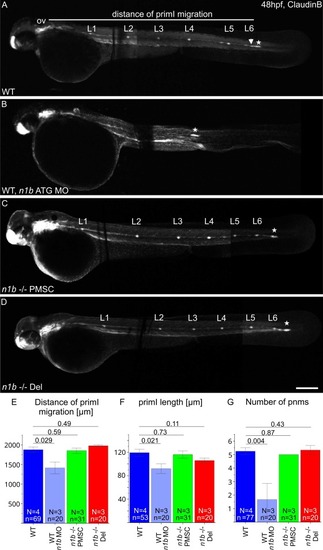
ncam1b knockdown and knockout leads to different phenotypes in the development of the lateral line system. (A–D) Lateral views of 48 hpf Tg(ClaudinB::lynGFP) (A) Wild type (WT) (B) n1b morphant, (C) n1b -/- PMSC and (D) n1b -/- Del. Embryos are oriented with rostral to the left and dorsal to the top. (A) At 48 hpf, primI (star) of WT reaches the tip of the tail and deposits 6 proneuromasts (L1-L6), with the last one having just been deposited (arrow). The migration distance was measured from the otic vesicle (ov) to primI. (B) ncam1b morpholino injection leads to reduced migration of a smaller primI and deposition of fewer proneuromasts. (C + D) n1b -/- PMSC and n1b -/- Del mutants phenocopy the WT phenotype, with primI reaching the tip of the tail at 48 hpt and depositing 6 proneuromasts (L1-L6). (E–G) Quantification of migration distance, primI length and number of proneuromasts in WT, ncam1b morpholino injected embryos, n1b -/- PMSC and n1b -/- Del. Bars indicate mean values of the medians of each experiment, with error bars representing standard error. Statistic was made using two-sided t-test. Scale bar 200 µm. Abbreviations: WT: Wild type; n1b -/- PMSC: ncam1b -/- Premature Stop Codon mutant; n1b -/- Del: ncam1b deletion mutant; MO: Morpholino; primI: primordium; pnm: proneuromast; ov: otic vesicle. |
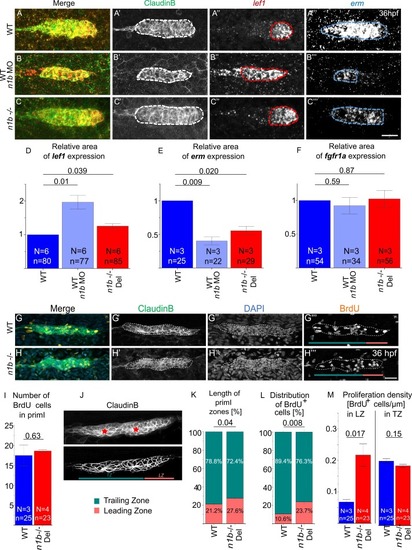
Loss of ncam1b leads to small differences in signaling and proliferation within the migrating primordium. (A-C) Fluorescence in situ hybridization of 36 hpf Tg(ClaudinB::lynGFP) primordia in (A) WT, (B) ncam1b morphants, and (C) n1b -/- Del. Areas for expression analysis were delineated in Fiji by drawing around regions that displayed a strong signal compared to the background, while regions with only weak or faint signals were excluded. Red outline indicates lef1 expression area, blue outline indicates erm expression area. (D–F) Quantification of regions expressing (D) lef1, (E) fgfr1a (microscopy images shown in Supp. 3), and (F) erm. ncam1b absence leads to an enlarged lef1 region and a reduced erm region, fgfr1a expression domain is unaffected. (G–M) BrdU staining reveals changes in proliferating cell distribution. (G-H) WT and ncam1b mutant Tg(ClaudinB::lynGFP) embryos were treated with BrdU at 36 hpf for 20 min and immunostained for BrdU (orange), GFP (green) and DAPI (blue) as indicated. Color bars in (G''' + H''') indicate the respective zones in turquoise for the Trailing Zone and reddish for the Leading Zone. (I) Numbers of BrdU-positive cells in WT and n1b -/- Del primordia. (J) Illustration of the subdivision of primI into Leading (LZ) and Trailing Zones (TZ) based on cell morphology. The upper panel shows the original image, while in the lower panel the contrast was enhanced to better visualize morphological differences between the TZ and LZ. Cells in the TZ are organized into rosette-like proneuromasts (epithelial character). They are arranged radially around a central prospective first hair cell (asterisk). The cells in the LZ display a more randomly oriented, mesenchymal-like morphology. (K) Changes in the length of Leading and Trailing Zone in ncam1b mutants compared to the wild type. (L) Redistribution of proliferating cells within Leading and Trailing Zones. (M) Proliferation density, as calculated by dividing the number of BrdU+ cell by the zone length, is significantly higher in the Leading Zone of ncam1b mutants compared to wild type. Bars indicate mean values of the medians of each experiment, with error bars representing standard error. Statistical test for (D–F, I, M): Two-sided t-test and for (K+L): χ2-test. Scale bars 20 µm. Abbreviations: WT: Wild type; n1b -/- Del: ncam1b deletion mutant; MO: Morpholino; primI: primordium; TZ: Trailing Zone; LZ: Leading Zone. |
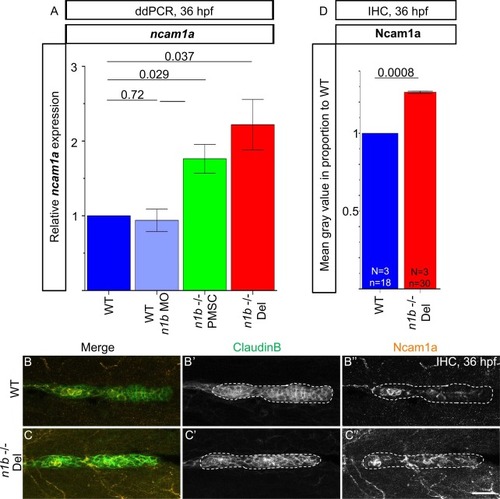
Upregulation of ncam1a in ncam1b mutant embryos. (A) ddPCR measurements normalized to the housekeeping gene β-actin show significant upregulation of ncam1a and in ncam1b mutants, but not in ncam1b morphants, at 36 hpf. Mean gene expression levels were determined using biological triplicates or quadruplicates, each representing the mean of technical duplicates. Wild type (WT), n1b -/- PMSC mutants, and n1b -/- Del mutants were analyzed, with pools of 100 embryos per condition. (B–D) Ncam1a expression (orange) in the migrating primordium (primI). (B) Tg(ClaudinB::lynGFP), serving as wild type, and (C) ncam1b -/- Del; Tg(ClaudinB::lynGFP). (B’ + C’) Utilizing ClaudinB::lynGFP expression, a threshold was set to delineate the outline of primI (white border), Ncam1a expression in this region (B’’ + C’’) was quantified by mean grey value measurement of using Fiji. (D) The mean grey value of the n1b -/- Del mutant normalized to the WT shows a significant upregulation of Ncam1a expression. Statistic was made using one sample t-test. Scale bar 20 µm. Abbreviations: WT: Wild type; n1b -/- PMSC: ncam1b -/- Premature Stop Codon mutant; n1b -/- Del: ncam1b deletion mutant; IHC: Immunohistochemistry. |
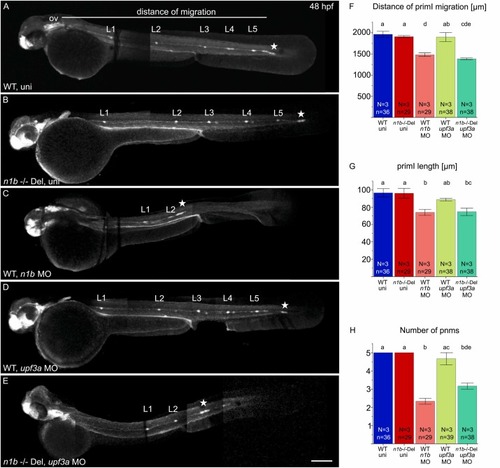
Knockdown of upf3a in ncam1b mutants partially phenocopies the ncam1b knockdown phenotype. (A–E) Lateral views of 48 hpf Tg(ClaudinB::lynGFP) (A) Wild type uninjected (WT uni) (B) n1b -/- Del uninjected, (C) n1b MO in WT, (D) upf3a MO in WT and (E) upf3a MO in n1b -/- Del. Embryos are oriented with rostral to the left and dorsal to the top. (A) At 48 hpf, primI (star) of WT reaches the tip of the tail and deposits 5 proneuromasts (L1–L5). The migration distance was measured from the otic vesicle (ov) to primI. (B) n1b -/- Del mutants show the same phenotype as WT, with primI reaching the tip of the tail and 5 deposited proneuromasts. (C) ncam1b MO injection leads to reduced migration of a smaller primI and deposition of fewer proneuromasts. (D) upf3a MO injection in WT does not induce any defects in lateral line system development. (E) upf3a MO injection in n1b -/- Del leads to reduced primI migration and fewer deposited neuromasts. (F–H) Quantification of migration distance, primI length and number of proneuromasts. Bars indicate mean values of relative numbers, with error bars representing standard error. Differences between the five groups were analyzed using a one-way ANOVA followed by Scheffé post hoc tests. Differences were considered significant if the F-value exceeded the critical Scheffé value (p < 0.05). Groups that share the same letter do not differ significantly. Groups with different letters show significant differences in their means. Scale bar 200 µm. Abbreviations: WT: Wild type; n1b -/- Del: ncam1b deletion mutant; MO: Morpholino; uni: uninjected; primI: primordium; pnm: proneuromast, ov: otic vesicle. |
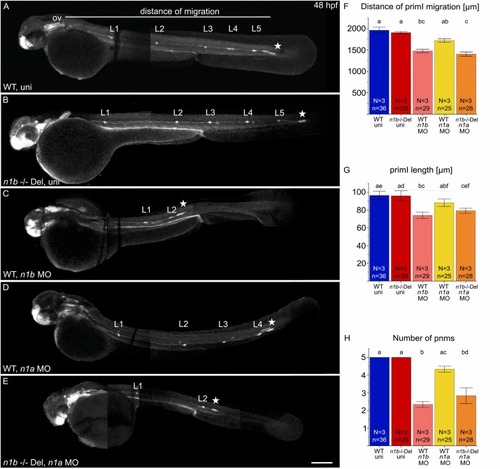
Knockdown of ncam1a in ncam1b mutants phenocopies the ncam1b knockdown phenotype. (A–E) Lateral views of 48 hpf Tg(ClaudinB::lynGFP) (A) Wild type uninjected (WT uni) (B) n1b -/- Del uninjected, (C) n1b MO in WT, (D) ncam1a MO in WT and (E) ncam1a MO in n1b -/- Del. Embryos are oriented with rostral to the left and dorsal to the top. (A) At 48 hpf, primI (star) of WT reaches the tip of the tail and deposits 5 proneuromasts (L1–L5). The migration distance was measured from the otic vesicle (ov) to primI. (B) n1b -/- Del mutants show the same phenotype as WT, with primI reaching the tip of the tail and 5 deposited proneuromasts. (C) ncam1b MO injection leads to reduced migration of smaller primI and deposition of fewer proneuromasts. (D) Injection of the ncam1a MO in wild type zebrafish caused moderate defects in lateral line system development, but these effects did not reach statistical significance. (E) ncam1a MO injection in n1b -/- Del induce reduced migration of a smaller primI and fewer deposited neuromasts. (F-H) Quantification of migration distance, primI length and number of proneuromasts. Bars indicate mean values of the medians of each experiment, with error bars representing standard error. Differences between the five groups were analyzed using a one-way ANOVA followed by Scheffé post hoc tests. Differences were considered significant if the F-value exceeded the critical Scheffé value (p < 0.05). Groups that share the same letter do not differ significantly. Groups with different letters show significant differences in their means. Scale bar 200 µm. Abbreviations: WT: Wild type; n1b -/- Del: ncam1b deletion mutant; MO: Morpholino; uni: uninjected; primI: primordium; pnm: proneuromast; ov: otic vesicle. |
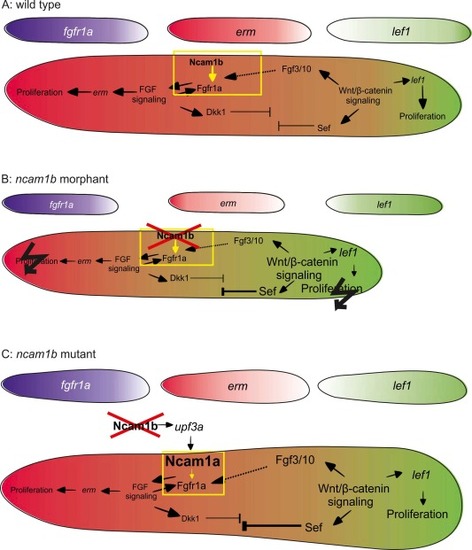
Model of signaling in the migrating primordium in WT, ncam1b morphant, and ncam1b mutant. Rostral is left, caudal is right. Small primordia depict fgfr1a (purple), erm (red), and lef1 (green) expression distributions, respectively. The large primordia represent overall complex signaling. erm (red) and lef1 (green) expression regions are color-coded. The yellow box highlights the interaction of Ncam1b or Ncam1a with Fgfr1a. Black flashes indicate severely disrupted proliferation. |