
- Title
-
Effect of Dync1h1 on Phototransduction Protein Transport and the Development and Maintenance of Photoreceptor Cells in Zebrafish
- Authors
- Zhou, X., Cao, J., Xie, J., Tong, W., Jia, B., Fu, J.
- Source
- Full text @ Invest. Ophthalmol. Vis. Sci.
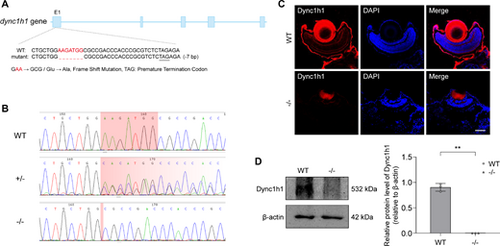
Identification of dync1h1 knockout zebrafish. (A) Schematic representation of the genomic region and exon/intron structure of dync1h1 in zebrafish. Knockout of dync1h1 results in a truncated protein, with deletion located in exon 1. (B) Direct sequencing comparison of WT, dync1h1+/−, and dync1h1−/− zebrafish lines. (C) Immunofluorescence staining showing dync1h1 protein expression in 5 dpf WT and dync1h1−/− zebrafish. Nuclei are stained with DAPI. (D) Western blot analysis of dync1h1 protein expression in 5 dpf WT and dync1h1−/− zebrafish, with β-actin as the endogenous control. +/−, dync1h1 heterozygote; −/−, dync1h1 homozygote. Scale bar = 50 µm. Data are shown as mean ± SD. **, P < 0.01, n = 3 biologically independent samples per group. DAPI, 4′,6-diamidino-2-phenylin-dole; dpf, days post fertilization; SD, standard deviation; WT, wild type. |
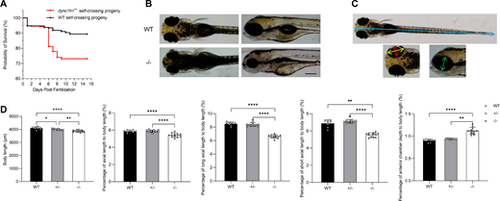
Impact of dync1h1 loss on zebrafish survival and overall development. (A) Kaplan-Meier survival curve for the progeny of self-crossed WT or dync1h1+/− zebrafish. (B) External morphology of WT and dync1h1+/− zebrafish at 5 dpf. (C) Schematic diagram illustrating measurement indicators at 5 dpf: body length (blue), axial length (red), long axial length (yellow), short axial length (green), and anterior chamber depth (white). (D) Quantitative analysis of binocular measurements as a percentage of body length in WT, dync1h1+/−, and dync1h1−/− zebrafish at 5 dpf. +/−, dync1h1 heterozygote; −/−, dync1h1 homozygote. Scale bar = 200 µm. Data were presented as mean ± SD. *, P < 0.05; **, P < 0.01; ****, P < 0.0001, n = 8 (WT), n = 10 (dync1h1+/−), and n = 12 (dync1h1−/−). dpf, days post fertilization; SD, standard deviation; WT, wild type. |
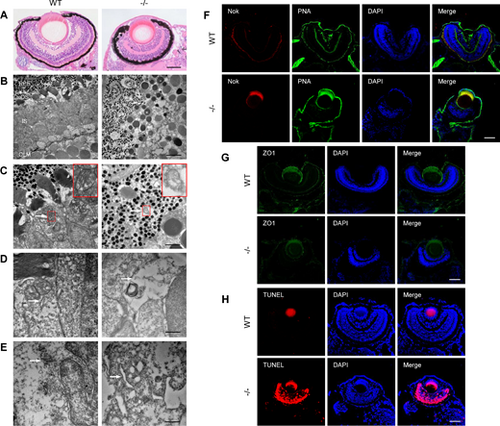
Retinal degeneration in dync1h1−/− zebrafish at 5 dpf. (A) Representative H&E-stained images of WT and dync1h1−/− retina. (B–E) TEM images of WT and dync1h1−/− retina. (B) Overview of the outer retina. (C) Mitochondria indicated by white arrows and zoom-in pictures shown in the red rectangle. (D) ER (white arrow). (E) Golgi (white arrow). (F) Immunofluorescence-stained cryosections showing PRC IS/OS using anti-Nok and PNA; nuclei are stained by DAPI. (G) Immunofluorescence-stained cryosections showing OLM integrity using anti-ZO1; nuclei stained by DAPI. (H) TUNEL assay images with DAPI-stained nuclei. −/−, dync1h1 homozygote. Scale bar = 50 µm (A, F–H), 5 µm (B), 2 µm in (C), 500 nm (D, E). DAPI, 4′,6-diamidino-2-phenylin-dole; dpf, days post fertilization; ER, endoplasmic reticulum; H&E, hematoxylin and eosin; IS/OS, inner segment/outer segment; Nok, nagie oko; ONL, outer nuclear layer; PNA, peanut agglutinin; PRC, photoreceptor cell; WT, wild type. |
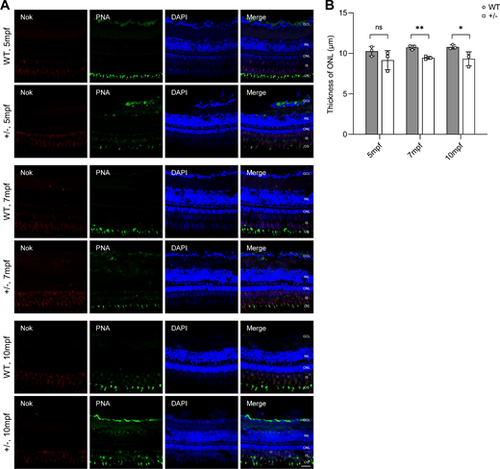
Mild but progressive retinal degeneration in adult dync1h+/− zebrafish. (A) Immunofluorescence-stained cryosections at indicated ages showing the PRC IS/OS stained with anti-Nok and PNA; nuclei stained by DAPI. (B) Quantitative analysis of ONL thickness in WT and dync1h1+/− retinas over time. +/−, dync1h1 heterozygote. Scale bar = 20 µm. Data are shown as mean ± SD. Not significant (ns), P > 0.05, *, P < 0.05; **, P < 0.01, n = 3 biologically independent samples per group. DAPI, 4′,6-diamidino-2-phenylin-dole; IS/OS, inner segment/outer segment; Nok, nagie oko; ONL, outer nuclear layer; PNA, peanut agglutinin; PRC, photoreceptor cell; SD, standard deviation; WT, wild type. |
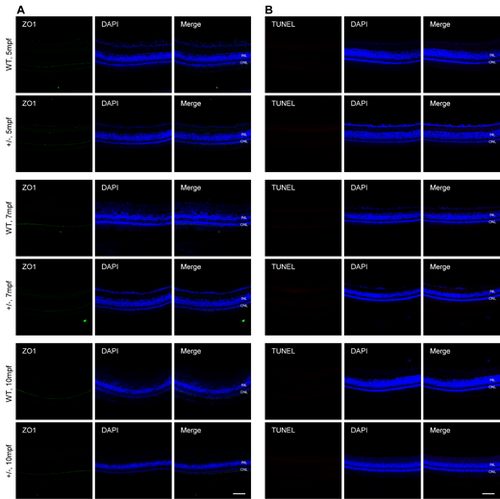
Dync1h1-deficiency maintains OLM integrity and PRC survival in adult dync1h+/− retina. (A) Immunofluorescence-stained cryosections at indicated ages showing OLM stained with anti-ZO1; nuclei stained by DAPI. (B) TUNEL assay images at indicated ages with DAPI-stained nuclei. +/−, dync1h1 heterozygote. Scale bar = 50 µm. DAPI, 4′,6-diamidino-2-phenylin-dole; OLM, outer limiting membrane; PRC, photoreceptor cell. |
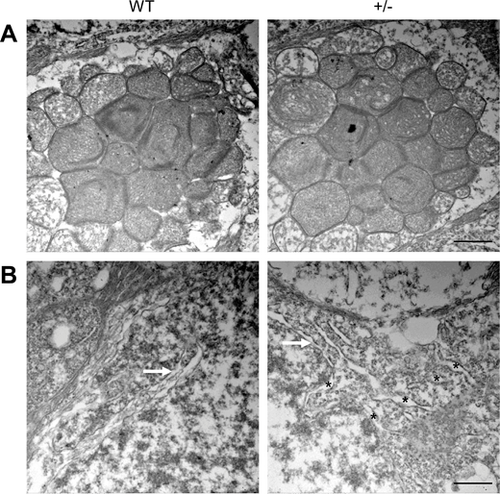
Prioritization of ER impairment in dync1h1+/− retinas at 20 mpf. (A) TEM images showing well-developed mitochondria in both WT and dync1h1+/− retinas. (B) TEM image highlighting well-developed Golgi (white arrow) in both WT and dync1h1+/− retinas. The black asterisks point to abnormally swollen ER scattering in IS. +/−, dync1h1 heterozygote. Scale bar = 1 µm (A), 500 nm (B). ER, endoplasmic reticulum; mpf, months post fertilization; WT, wild type. |
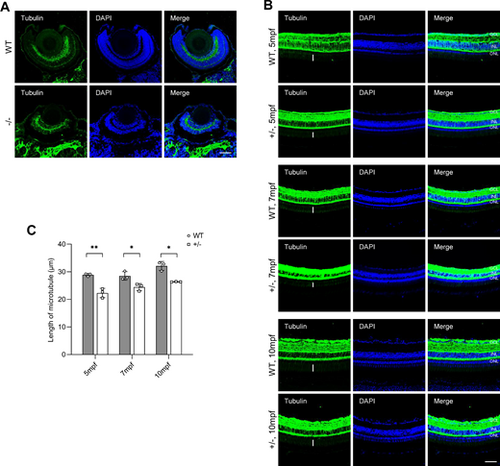
Dync1h1-deficiency impairs cilium biogenesis. (A) PRC cilium biogenesis in WT and dync1h1−/− retinas at 5 dpf, detected by immunofluorescence for axonemal microtubules using anti-α-acetylated tubulin antibody; nuclei stained by DAPI. (B) PRC development in WT and dync1h1+/− retinas at indicated ages, with axonemal microtubules by anti-α-acetylated tubulin; nuclei stained by DAPI. The lengths of microtube were labeled with white vertical lines. (C) Quantitative analysis of microtubule length in WT and dync1h1+/− retinas across ages. +/−, dync1h1 heterozygote; −/−, dync1h1 homozygote. Scale bar = 50 µm. Data are shown as mean ± SD. *, P < 0.05; **, P < 0.01, n = 3 biologically independent samples per group. DAPI, 4′,6-diamidino-2-phenylin-dole; dpf, days post fertilization; PRC, photoreceptor cell; SD, standard deviation; WT, wild type. |
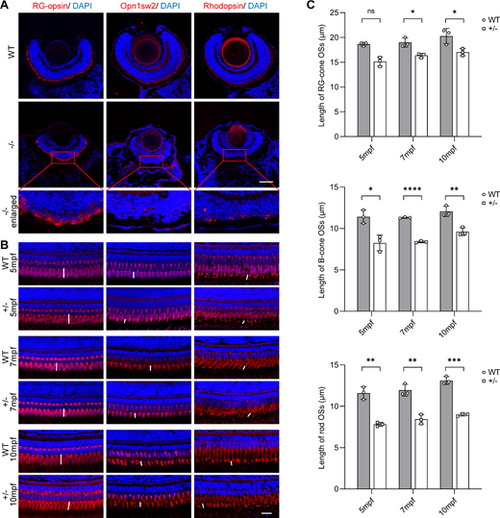
Transport disorder of phototransduction proteins in PRCs due to dync1h1-deficiency. (A, B) Immunofluorescence images of WT and dync1h1−/− retinas at 5 dpf, and WT and dync1h1+/− retinas at indicated ages, with anti-RG-opsin antibody, anti-Opn1sw2, and anti-Rhodopsin antibodies marking blue-cone opsin, red/green-cone opsin, and rhodopsin, respectively. Nuclei are stained by DAPI. Zoom-in pictures were shown in the red rectangle. The lengths of OS were labeled with white vertical lines. (C) Quantitative analysis of the lengths of RG-cone OS, B-cone OS, and rod OS in WT and dync1h1+/− retinas at indicated ages. +/−, dync1h1 heterozygote; −/−, dync1h1 homozygote. Scale bar = 50 µm (A), 20 µm (B). Data are shown as mean ± SD. Not significant (ns), P > 0.05; *, P < 0.05; **, P < 0.01; ***, P < 0.001; ****, P < 0.0001, n = 3 biologically independent samples per group. DAPI, 4′,6-diamidino-2-phenylin-dole; dpf, days post fertilization; H&E, hematoxylin and eosin; OS, outer segment; PRC, photoreceptor cell; WT, wild type; SD, standard deviation. |
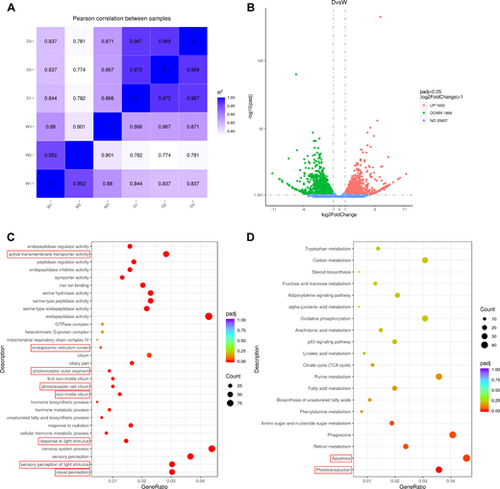
Bioinformatic analysis reveals phototransduction disruption and apoptosis in dync1h1−/− zebrafish at 5 dpf. (A) Pearson correlation analysis comparing WT and dync1h1−/− samples. (B) Volcano plot showing differential gene expression, with 1652 upregulated and 1856 downregulated genes (|log2 (FoldChange)|≥1 and adjusted P value ≤ 0.05). (C) Top Gene Ontology (GO) terms enriched among all differentially expressed genes. (D) Top KEGG pathways enriched among all differentially expressed genes. W1 to W3, three independent samples from the WT group; D1 to D3, three independent samples from dync1h1−/− group. WT, wild type. |
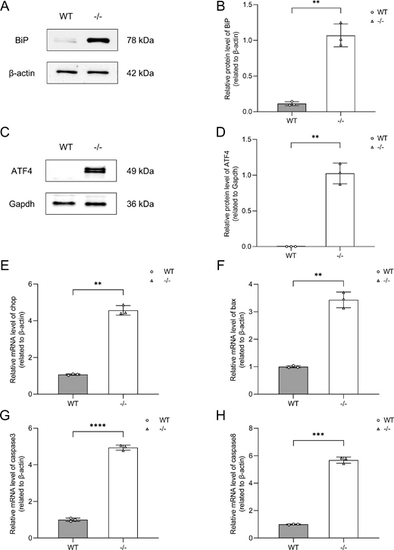
Validation of ER stress-induced apoptosis pathway in vivo. (A) Western blot analysis of BiP expression in WT and dync1h1−/− zebrafish at 5 dpf, with β-actin as the endogenous control. (B) Quantitative analysis showing elevated BiP levels in dync1h1−/− compared to WT. (C) Western blot analysis of ATF4 protein expression in WT and dync1h1−/− zebrafish at 5 dpf, with Gapdh as endogenous control. (D) Quantitative analysis showing elevated ATF4 protein levels in dync1h1−/− compared to WT. (E–H) The qRT-PCR analysis showing increased mRNA levels of chop, bax, caspase3, and caspase8 in dync1h1−/− relative to WT. β-actin was used as the endogenous control. −/−, dync1h1 homozygote. Data are shown as mean ± SD. **, P < 0.01; ***, P < 0.001; ****, P < 0.0001, n = 3 biologically independent samples per group. ATF 4, activating transcription factor 4; WT, wild type; BiP, binding immunoglobulin protein; ER, endoplasmic reticulum; qRT-PCR, quantitative real-time polymerase chain reaction; SD, standard deviation. |