FIGURE SUMMARY
Title

Trehalose Ameliorates Zebrafish Emotional and Social Deficits Caused by CLN8 Dysfunction

Authors
Licitra, R., Della Vecchia, S., Santucci, L., Vivarelli, R., Bernardi, S., Santorelli, F.M., Marchese, M.
Source
Full text @ Cells

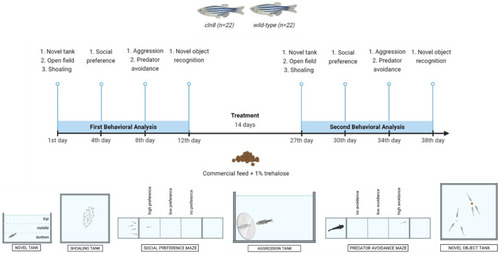
Schematic representation of the experimental trial.

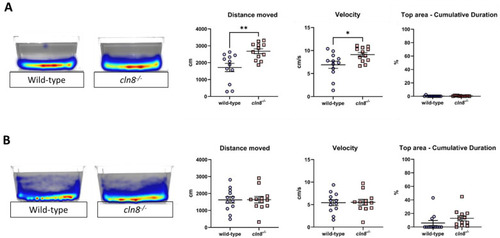
Novel tank test behavioral results before (A) and after (B) the trehalose treatment on cln8−/− and WT fish (n = 12). Data are represented as individual values (lines indicate means ± SEM). Statistical analyses showed increasing anxiety in cln8−/− compared to WT before the trehalose feed supplementation (* p ≤ 0.05; ** p ≤ 0.01). The images on the left are representative of the heatmap locomotor activity during the test, the range of color is from dark blue (low activity) to red (high activity).

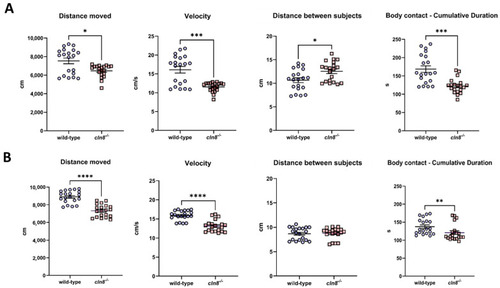
Shoaling test behavioral results before (A) and after (B) the trehalose treatment on cln8−/− and WT fish (n = 20). Data are represented as individual values (lines indicate means ± SEM). Statistical analyses showed impairments in swimming performances and shoal cohesion in cln8−/− compared to WT both before and after the trehalose feed supplementation (except for distance between subjects mitigated by trehalose treatment) (* p ≤ 0.05; ** p ≤ 0.01; *** p ≤ 0.001; **** p ≤ 0.0001).

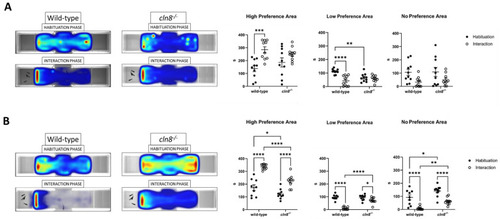
Social preference test behavioral results before (A) and after (B) the trehalose treatment on cln8−/− and WT fish (n = 10). Data are represented as individual values (lines indicate means ± SEM) and expressed in terms of cumulative duration. Statistical analyses showed impairments in sociality in cln8−/− compared to WT before the trehalose feed supplementation (* p ≤ 0.05; ** p ≤ 0.01; *** p ≤ 0.001; **** p ≤ 0.0001). The images on the left are representative of the heatmap locomotor activity during the test; the range of color is from dark blue (low activity) to red (high activity).

Aggression test results before (A) and after (B) trehalose treatment on cln8−/− and WT fish (n = 12). Data are represented as individual values (lines indicate means ± SEM). Statistical analyses showed higher aggressiveness in cln8−/− compared to WT before the trehalose feed supplementation (except for females, which proved to be more aggressive even after treatment) (** p ≤ 0.01; *** p ≤ 0.001; **** p ≤ 0.0001). The images on the left are representative of the heatmap locomotor activity during the test; the range of color is from dark blue (low activity) to red (high activity).

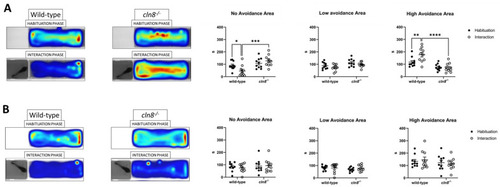
Predator avoidance test results before (A) and after (B) trehalose treatment on cln8−/− and WT fish (n = 10). Data are represented as individual values (lines indicate means ± SEM) and expressed in terms of cumulative duration. Statistical analyses showed impairments in predator avoidance in cln8−/− compared to WT before the trehalose feed supplementation (* p ≤ 0.05; ** p ≤ 0.01; *** p ≤ 0.001; **** p ≤ 0.0001). The images on the left are representative of the heatmap locomotor activity during the test; the range of color is from dark blue (low activity) to red (high activity).

Novel object tests behavioral results before (A) and after (B) the trehalose treatment on cln8−/− and WT fish (n = 12). Data are represented as individual values (lines indicate means ± SEM). Statistical analyses showed impairments in cognitive abilities in cln8−/− compared to WT both before and after the trehalose feed supplementation (* p ≤ 0.05; ** p ≤ 0.01; *** p ≤ 0.001; **** p ≤ 0.0001).

Acknowledgments
This image is the copyrighted work of the attributed author or publisher, and ZFIN has permission only to display this image to its users. Additional permissions should be obtained from the applicable author or publisher of the image. Full text @ Cells