
- Title
-
Protective effects of sulfated polysaccharides from Enteromorpha intestinalis on oxidative stress, liver iron overload and Ferroptosis in Zebra fish exposed to ethanol
- Authors
- Khazaei, M., Ardeshir, R.A.
- Source
- Full text @ Biomed. Pharmacother.
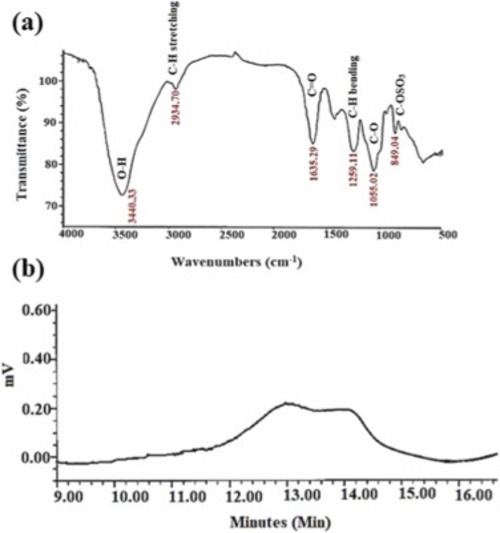
FT-IR spectrum (a) and HPSEC chromatographic profile (b) of sulphated polysaccharides extracted from E. intestinalis. |

Iron ion content in liver of adult zebrafish exposed to ethanol in the water (EE) and ethanol-exposed group supplemented with E. intestinalis polysaccharide (EE+EIP), compared to control (mean ± SD); (n=21);*:Indicates a significant difference with the control group; #: indicates a significant difference with other groups. (P < 0.05). |
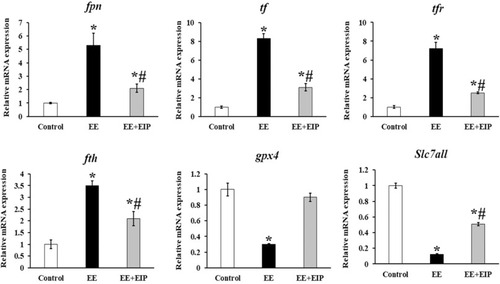
The expression levels of ferroptosis-related genes in the liver of adult zebrafish exposed to ethanol in the water (EE) and ethanol-exposed group supplemented with E. intestinalis polysaccharide (EE+EIP), compared to control (mean ± SD); (n=18) *: Indicates a significant difference with the control group; #: indicates a significant difference with other groups. (P < 0.05). |
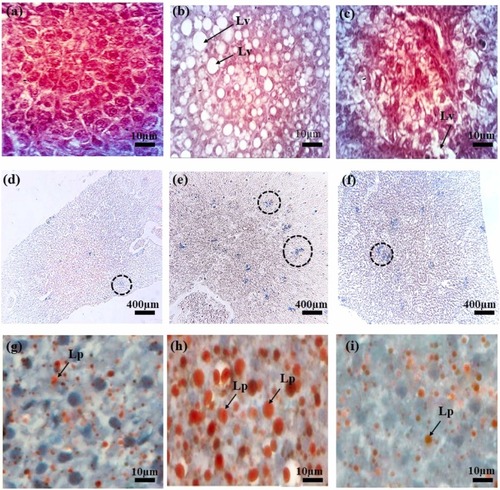
Hematoxylin-eosin staining (a,b,c) (n=18), Perls’ staining (d,e,f) (n=40) and Red oil O staining (g,h,i) (n=18) of liver tissues of zebrafish in experimental group; Control: a,d,g, ethanol in the water; Ethanol-exposed group (EE): b,e,h,; Ethanol-exposed group supplemented with E. intestinalis polysaccharide (EE+EIP): c,f,i.; Lv: lipid vacuole; Lp: Lipid droplet; Circles in Figs. d to f indicate blue granules in the liver tissue. |

Iron deposition in liver tissues (blue granules) through Perls’ staining in liver tissue of zebrafish in experimental group (a), The size (b) and number of blue granules in the liver tissue of zebrafish (n=40). *:Indicates a significant difference with the control group; #: indicates a significant difference with other groups. (P < 0.05). |