FIGURE SUMMARY
Title

Starvation-resistant cavefish reveal conserved mechanisms of starvation-induced hepatic lipotoxicity

Authors
Pozo-Morales, M., Cobham, A.E., Centola, C., McKinney, M.C., Liu, P., Perazzolo, C., Lefort, A., Libert, F., Bai, H., Rohner, N., Singh, S.P.
Source
Full text @ Life Sci Alliance

Response of cavefish and surface fish larvae to starvation.

(A) Survival curves for surface fish, Pachón cavefish, and Tinaja cavefish larvae upon starvation are shown by log-rank Kaplan–Meier plots with a 95% confidence interval. (B) Number of hepatic lipid droplets per unit volume from 6 to 12 dpf under fasting. (C) Mean ± SEM of liver size in surface fish, Pachón cavefish, and Tinaja cavefish at 6, 8, and 12 dpf without exogenous feeding. **P < 0.01. (D) Maximum-intensity projections of representative livers from surface fish, Pachón cavefish, and Tinaja cavefish stained with Nile Red (red) at 6, 8, 10, and 12 dpf without exogenous feeding. Scale bar = 10 μm.

Reduction in the size of liver upon accumulation of lipid droplets during starvation.

(A) Maximum-intensity projections (MIP) of Tg(fabp10a:GFP) (referred to as WT) stained with Nile Red. Hepatocytes are false-colored in pink and lipid droplets in yellow. A timeline from 4 to 8 dpf of zebrafish larvae without exogenous food is presented. (B) Representative MIP images of timeline from Tg(fabp10a:nls-mCherry); Tg(mpeg1.1:EGFP) zebrafish from 4 to 8 dpf under the fasting condition. Arrows label macrophages with hepatocyte debris. A zoom of boxed regions is presented below the images. (C) Line trace representing lipid droplets and macrophages normalized to the liver area from 4 to 8 dpf. Comparisons with 6 dpf are represented. P-values: * < 0.05; ** < 0.01, and *** < 0.001, ANOVA test followed by the post hoc Tukey test. (D) MIP of Nile Red staining of Tg(fabp10a:SpiCee-mCherry), with hepatocytes false-colored in pink and lipid droplets in yellow. Representative images from 4 to 8 dpf fasting are presented. (E) Livers from 4 to 8 dpf from fasting Tg(fabp10a:SpiCee-mCherry); Tg(mpeg1.1:EGFP) are presented with MIP. Macrophages with hepatocyte debris are marked with arrows. A zoom of boxed regions is presented below the images. (F) Line trace representing lipid droplets and macrophages normalized to the liver area from 4 to 8 dpf in Tg(fabp10a:SpiCee-mCherry) animals. Comparisons with WT are shown. P-values: ns, not significant, * < 0.05, ** < 0.01, and *** < 0.001, t test or Mann–Whitney U test depending on the normality of the data. (G) Mean ± SEM of liver size in WT and Tg(fabp10a:SpiCee-mCherry) at 6 and 8 dpf without exogenous feeding. P-values: ns, not significant, * < 0.05, and ** < 0.01, t test. (H) Snapshots of livers at 8 dpf from Tg(fabp10a:nls-mCherry); Tg(mpeg1.1:GFP) fasting animals treated with 0.17% DMSO (vehicle) or 50 μM liproxstatin-1. Hepatocytes are false-colored in pink, and macrophages are false-colored in cyan. White arrows indicate macrophages with hepatocyte phagocytosis. (I) Mean ± SEM of the number of macrophages normalized by liver area in vehicle- and liproxstatin-1–treated animals. Each point represents a single animal. **P < 0.01, Mann–Whitney U test. (J) Mean ± SEM of the liver area in control and liproxstatin-1–treated animals at 8 dpf. Scale bar for all panels = 20 μm.

Slc27a2a is responsible for starvation-induced lipid accumulation.

(A) Multidimensional scaling plot of gene expression changes in the liver upon fasting in zebrafish, surface fish, and Tinaja cavefish. For zebrafish, livers from 4 dpf were compared with 6 dpf, whereas for surface and cavefish, the comparison was made between 5 and 7 dpf. (B, C) Venn diagram of differentially expressed genes (B) and genes up-regulated by fasting (C) for the three animals. (D, E) Gene ontology (GO) analysis for genes up-regulated by fasting in all the three animals (D) and for zebrafish and surface fish only (E). (F) Barplot displaying the changes in lipid transporters upon fasting. *** false discovery rate < 0.05 and log2(fold change) > 1.5. ### (false discovery rate) < 0.05, but log2(fold change) < 1.5. (G) Maximum-intensity projections of 6 dpf fasting Tg(fabp10a:GFP) (pink) with Nile Red staining (yellow) treated with 5 μM of lipofermata or 0.01% of DMSO (vehicle) from 4 to 6 dpf fast. Scale bar = 20 μm. (H, I) Barplot with the mean ± SEM of the number of lipid droplets per liver (H) and liver size (I) in vehicle- and lipofermata-treated animals. Each point represents a single animal. ns, not significant, ***P < 0.001, t test.

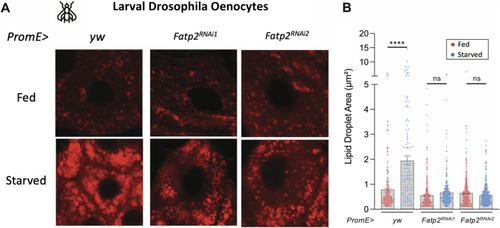
FATP2 is an evolutionarily conserved regulator of starvation-induced lipidosis.

(A) Confocal images of Drosophila oenocytes from fed and starved larvae. Control or oenocyte-specific FATP2 RNAi animals were evaluated. (B) Barplot comparing the lipid droplet area in the fed or fasting condition in control and FATP2 RNAi animals. ns > 0.05, ****P < 0.0001, ANOVA test followed by the post hoc Tukey test.

slc16a6a is not mutated in the experimental animals.

A representative chromatogram of the slc16a6a cDNA generated from Tg(fabp10a:EGFP) animals used in the study. The start codon, exons 2 and 3 of the slc16a6a gene, and the region deleted in the slc16a6a mutant s951 (Hugo et al, 2012) are labeled.

Macrophages in the liver of 8 dpf zebrafish upon normal feeding.

(A) Confocal image of Tg(fabp10a:nls-mCherry); Tg(mpeg1.1:EGFP) zebrafish at 8 dpf under fed conditions. (B) Distribution of the number of macrophages present in the liver normalized by the area of the liver at 8 dpf upon feeding. Each point represents a single animal.

Accumulation of hepatic lipid droplets after removal of lipofermata.

(A, B, C)Tg(fabp10a:GFP) zebrafish were treated with 5 μM of lipofermata or 0.01% of DMSO (vehicle) from 4 to 6 dpf fast. The drugs were washed, and the animals were allowed to recover. (A) Maximum-intensity projections of 7 and 8 dpf fasting Tg(fabp10a:GFP) (pink) with Nile Red staining (yellow) treated with 5 μM of lipofermata or 0.01% of DMSO (vehicle) from 4 to 6 dpf fast. Scale bar = 20 μm. (B, C) Barplot with the mean ± SEM of the number of lipid droplets per liver (B) and liver size (C) in vehicle- and lipofermata-treated animals. (D) Surface fish larvae were treated with 2 μM of lipofermata or 0.01% of DMSO (vehicle) from 5 to 7 dpf fast. The drugs were washed, and the animals were allowed to recover for 48 h. Barplot with the mean ± SD of the number of lipid droplets normalized by liver volume in vehicle- and lipofermata-treated surface fish larvae. Each point represents a single animal. *P < 0.05, **P < 0.01, and ***P < 0.001, t test.

Transcriptional changes in the liver of 6 dpf fasting zebrafish upon lipofermata treatment.

(A) Volcano plot depicts the changes in gene expression in the liver of 6 dpf fasting zebrafish upon 48 h of lipofermata treatment. Up- and down-regulated genes are colored in blue and orange, respectively. (B, C) Barplot displaying the changes in selected cell cycle–related genes (B) and cytokines (C). All the plotted genes display gene expression differences with a false discovery rate < 0.1. (D) Mean ± SEM of the number of macrophages normalized by the liver area in vehicle- and lipofermata-treated animals at 6 dpf under fasting conditions. Each point represents a single animal. ns, P > 0.05, t test.

Lipofermata treatment does not impact animal growth, liver size in fed animals, or starvation resistance.

(A, B) Representative brightfield images (A) and quantification of body size (B) of 6 dpf zebrafish larvae treated with vehicle (0.01% DMSO) or 5 μM of lipofermata from 4 to 6 dpf without exogenous feeding. (C, D) MIP of the liver from Tg(fabp10a:EGFP) animals (C) and quantification of the liver area (D) of 8 dpf zebrafish larvae fed with rotifers from 5 dpf onward and treated with vehicle or lipofermata overnight from 6 to 8 dpf. ns, P > 0.05, t test. (E) Survival curves for zebrafish larvae treated with vehicle or lipofermata from 4 to 6 dpf without exogenous feeding.

Acknowledgments
This image is the copyrighted work of the attributed author or publisher, and ZFIN has permission only to display this image to its users. Additional permissions should be obtained from the applicable author or publisher of the image. Full text @ Life Sci Alliance