
- Title
-
Zebrafish as a model to investigate a biallelic gain-of-function variant in MSGN1, associated with a novel skeletal dysplasia syndrome
- Authors
- Koparir, A., Lekszas, C., Keseroglu, K., Rose, T., Rappl, L., Rad, A., Maroofian, R., Narendran, N., Hasanzadeh, A., Karimiani, E.G., Boschann, F., Kornak, U., Klopocki, E., Özbudak, E.M., Vona, B., Haaf, T., Liedtke, D.
- Source
- Full text @ Hum. Genomics
|
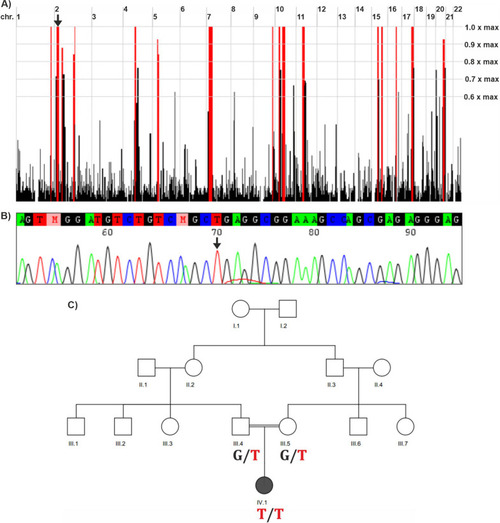
Genetic results of the family. |
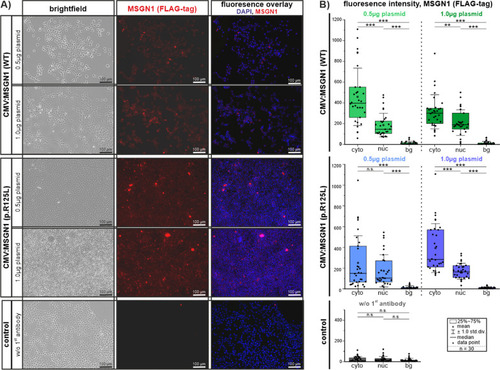
In vitro transfection of HEK 293T cells with CMV:MSGN1 (WT)-FLAG-tag and CMV:MSGN1 p.(Arg125Leu)-FLAG-tag plasmids at different concentrations. |
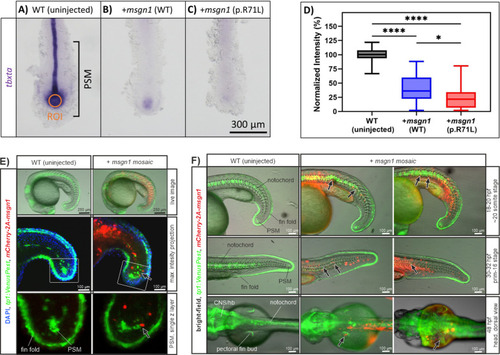
In situ hybridization images of |
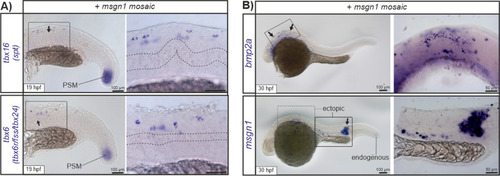
|