FIGURE SUMMARY
Title

Bi-allelic variants in CELSR3 are implicated in central nervous system and urinary tract anomalies

Authors
Stegmann, J.D., Kalanithy, J.C., Dworschak, G.C., Ishorst, N., Mingardo, E., Lopes, F.M., Ho, Y.M., Grote, P., Lindenberg, T.T., Yilmaz, Ö., Channab, K., Seltzsam, S., Shril, S., Hildebrandt, F., Boschann, F., Heinen, A., Jolly, A., Myers, K., McBride, K., Bekheirnia, M.R., Bekheirnia, N., Scala, M., Morleo, M., Nigro, V., Torella, A., TUDP consortium, Pinelli, M., Capra, V., Accogli, A., Maitz, S., Spano, A., Olson, R.J., Klee, E.W., Lanpher, B.C., Jang, S.S., Chae, J.H., Steinbauer, P., Rieder, D., Janecke, A.R., Vodopiutz, J., Vogel, I., Blechingberg, J., Cohen, J.L., Riley, K., Klee, V., Walsh, L.E., Begemann, M., Elbracht, M., Eggermann, T., Stoppe, A., Stuurman, K., van Slegtenhorst, M., Barakat, T.S., Mulhern, M.S., Sands, T.T., Cytrynbaum, C., Weksberg, R., Isidori, F., Pippucci, T., Severi, G., Montanari, F., Kruer, M.C., Bakhtiari, S., Darvish, H., Reutter, H., Hagelueken, G., Geyer, M., Woolf, A.S., Posey, J.E., Lupski, J.R., Odermatt, B., Hilger, A.C.
Source
Full text @ NPJ Genom Med

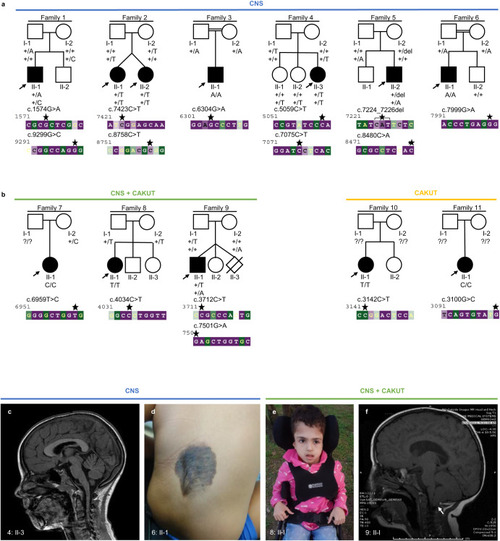
Families with bi-allelic variants in CELSR3 and clinical images.

a Pedigrees of six families (1–6) with a predominant central nervous system (CNS) phenotype. b Pedigrees of three families (7–9) with combined CNS phenotype and congenital anomalies of the kidneys and urinary tract (CAKUT), and two families (10, 11) with CAKUT only. The evolutionary conservation of the affected sequence (bp) was estimated with the ConSurf server from variable (green) to conserved (purple). Asterisks: Position of the respective variants. The arrows indicate probands. Filled shapes should reflect affected status. c Brain magnetic resonance image (MRI) of 4: II-3 showing pachygyria. d Photograph of 6: II-1 showing a congenital hairy melanocytic nevus with a diameter of 0.1 to 0.15 meter at the level of the lower lumbal spine. Radiologic imaging of the spine was not performed here. e Photograph of 8: II-1 showing macrocephaly, high and prominent forehead and very small and low-set ears. f MRI of 9: II-1. Arrow: Chiari malformation type 1 (cerebellar tonsillar herniation).

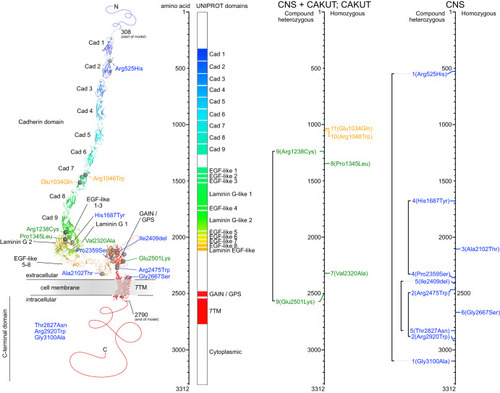
Structural modeling of CELSR3 and mapping of the variants.

Structural modeling of CELSR3 and the respective variants according to the amino acid (aa) position. Left panel: 3D protein domain view and variant annotation using AlphaFold and PyMOL. Middle panel: Linearized aa view of the protein domains. Right panels: Variant location according to the respective phenotype categories: Central nervous system (CNS) anomalies in blue, combined CNS and congenital anomalies of the kidneys and urinary tract (CAKUT) in green, CAKUT only in yellow. Cad Cadherin, EGF Epidermal growth factor, GAIN G-protein-coupled receptor (GPCR) autoproteolysis-inducing domain, GPS GPCR proteolysis site, 7TM Seven-transmembrane.

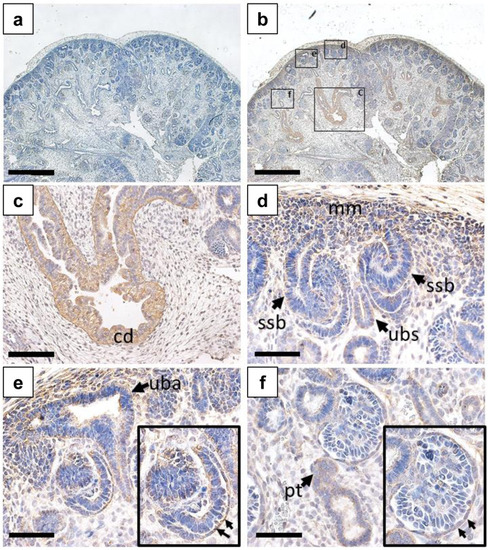
CELSR3 immunostaining in the human embryonic metanephric kidney at ten weeks gestation.

All frames depict a ten-week gestation kidney with nuclei counterstained (blue) with hematoxylin. a Low power view of midsagittal section with primary antibody omitted. The nephrogenic cortex is uppermost and the medulla is in the low part of the image. Note the absence of brown color. b Adjacent section to that depicted in a. but immuno-stained for CELSR3. Note the positive signal (brown) in diverse structures. Boxed areas are detailed in c-f. c CELSR3 was detected in branching medullary collecting ducts (cd). d The nephrogenic cortex contains immature structures. CELSR3 was detected in the ureteric bud branch stalk (ubs) which is flanked by nephron precursors called S-shape bodies (ssb). The metanephric mesenchyme (mm) stained weakly for CELSR3. e Another view of the nephrogenic cortex showing the ureteric bud branch ampullary tip (uba). These epithelia were weakly positive for CELSR3. Lower in the same image is an immature glomerulus with prominent CELSR3 immunostaining in the Bowman capsule, or parietal epithelia (arrows in the boxed enlargement). f The Bowman capsule of a more mature glomerulus has downregulated CELSR3 (arrows in boxed enlargement), and there is weak immunostaining in a nearby proximal tubule (pt). Bars are 2 mm in frames a and b, and 200 µm in frames cf.

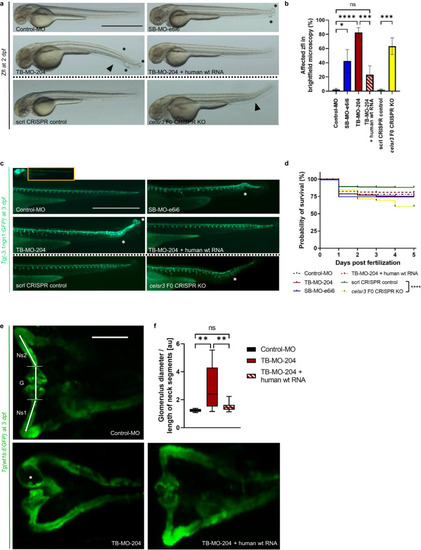
Transient suppression of Celsr3 in zebrafish larvae.

Phenotypic evaluation of the different zebrafish larvae (zfl) groups: Zfl injected with Control-Morpholino (Control-MO), zfl injected with MO blocking celsr3 splice site exon 6 – intron 6 (SB-MO-e6i6), zfl injected with MO blocking transcript celsr3-204 (TB-MO-204), zfl co-injected with TB-MO-204 and human wild-type (wt) CELSR3 polyA mRNA, zfl injected with scrambled (scrl) CRISPR control and celsr3 F0 CRISPR knockout (KO) mixes. a Representative brightfield microscopy of laterally mounted zfl at two days post fertilization (dpf) treated with 1-phenyl 2-thiourea (PTU). Asterisks: Example caudal end disruption. Arrowhead: Example warped tail. Scale bar 1000 µm. b Percentage of affected zfl in brightfield microscopy. TB-MO-204 injected zfl and celsr3 F0 CRISPR KO zfl show highly significant affection of a warped tail and/or caudal end disruption. In most zfl exposed to TB-MO-204 the phenotype could be rescued with human wt polyA CELSR3 mRNA. Number (n) of zfl for each injection group: Control-MO (n = 157), SB-MO-e6i6 (n = 278), TB-MO-204 (n = 223), TB-MO-204 + human wt RNA (n = 221), scrl CRISPR control (n = 416) and celsr3 F0 CRISPR KO (n = 440). Number of independent experiments N = 3 for both MO and CRISPR. c Representative laterally mounted Tg(-3.1ngn1:GFP) zfl at three dpf treated with PTU and imaged from lateral to visualize the effect of Celsr3 MO knockdown (MO-KD) or F0 celsr3 KO on neurogenesis. The structural irregularities at the caudal end of the MO-KD or F0 celsr3 KO zfl correlate with a disruption of the neuronal arrangement (white asterisks). Scale bar 1000 µm. d Kaplan–Meier plot showing a comparable survival rate for each respective injection group. Number (n) of zf embryos for each injection group: Control-MO (n = 203), SB-MO-e6i6 (n = 367), TB-MO-204 (n = 290), TB-MO-204 + human wt RNA (n = 272), scrl CRISPR control (n = 469) and celsr3 F0 CRISPR KO (n = 611). Number of independent experiments N = 3 each. e Representative dorsally mounted Tg(wt1b:EGFP) zfl at three dpf treated with PTU and imaged from dorsal to visualize the effect of Celsr3 MO-KD on the development of the pronephros. White asterisk: Example enlarged glomerulus. G: Glomerulus. Ns1: Right neck segment. Ns2: Left neck segment. Scale bar 100 µm. f Box plot showing the size of the glomerulus in relation to the neck segments (G/((Ns1 + Ns2)/2)) calculated for each Tg(wt1b:EGFP) zfl at three dpf. MO-injected zfl show a highly significant increase of the glomerular diameter in comparison to the length of the neck segments. This effect was almost completely rescued when TB-MO-204 was co-injected together with human CELSR3 wt polyA mRNA. Control-MO (n = 22), TB-MO-204 (n = 27), TB-MO-204 + human wt RNA (n = 29). Number of independent experiments N = 3. *p-value < 0.05, **p-value < 0.01, ***p-value < 0.001, ****p-value < 0.0001, ns not significant. Two-way ANOVA. Mean: SEM.

Acknowledgments
This image is the copyrighted work of the attributed author or publisher, and ZFIN has permission only to display this image to its users. Additional permissions should be obtained from the applicable author or publisher of the image. Full text @ NPJ Genom Med