
- Title
-
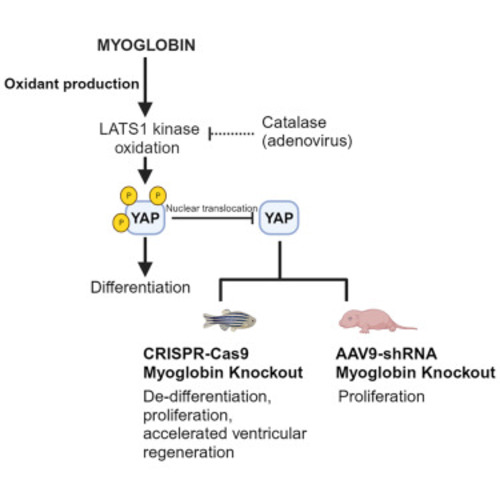
Myoglobin modulates the Hippo pathway to promote cardiomyocyte differentiation
- Authors
- Rao, K., Rochon, E., Singh, A., Jagannathan, R., Peng, Z., Mansoor, H., Wang, B., Moulik, M., Zhang, M., Saraf, A., Corti, P., Shiva, S.
- Source
- Full text @ iScience
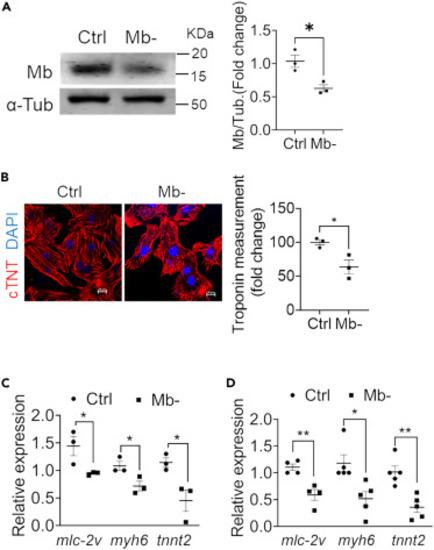
Deletion of endogenous myoglobin inhibits cardiomyocyte differentiation (A) Representative western blot and quantification of Mb in NRVMs treated with control (Ctrl) or Mb targeted siRNA (Mb−). N = 3. (B) Representative immunofluorescence images of NRVMs stained for cardiac troponin T (cTNT; red) to visualize sarcomeric structures and DAPI for nuclei (blue). Relative quantification of troponin fiber lengths in Mb− cells relative to control cells. Scale bar: 10 μm. N = 3. (C) Relative mRNA expression of cardiac structural differentiation markers-mlc-2v (myosin light chain), myh6 (myosin heavy chain), tnnt2 (cardiac troponinT)- in NRVM compared to control undifferentiated cells after Mb knockdown. N = 3. (D) Relative mRNA expression levels of cardiac structural differentiation markers in control and Mb− H9C2 cells. N = 4–5. Data are mean ± SEM; ∗p < 0.05, ∗∗p < 0.01. |
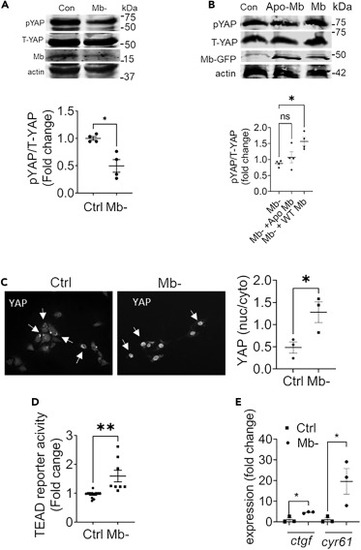
Myoglobin propagates YAP phosphorylation and inhibits its activity (A) Representative western Blot and quantification of phospho-YAP (pYAP) and total YAP (T-YAP) in control and Mb− cells 48 h after knockdown, quantified as fold change of control; N = 4. (B) Representative western blot and quantitation of pYAP and T-YAP levels in cells with Mb knockdown (control), followed by overexpression of Mb or Apo-Mb for 48 h using GFP tagged Mb or Apo-Mb plasmid. N = 4. (C) Representative immunofluorescence images depicting YAP cellular localization in control and Mb− H9C2 cells. Arrows point to instance of cytoplasmic signal (Ctrl) and nuclear signal (Mb− image). Quantification is the ratio of nuclear to cytoplasmic staining intensity of YAP from 6 high-power field per sample; N = 3. Scale bar: 100 μm. (D) TEAD-luciferase reporter signal in Mb− expressed as fold change of control cells; N = 3. (E) Fold change over control in relative mRNA expression of YAP transcriptional target genes -ctgf and cyr61-in control and Mb− cells; N = 3. Data are mean ± SEM. ∗p < 0.05, ∗∗p < 0.01, n.s. = not significant. |
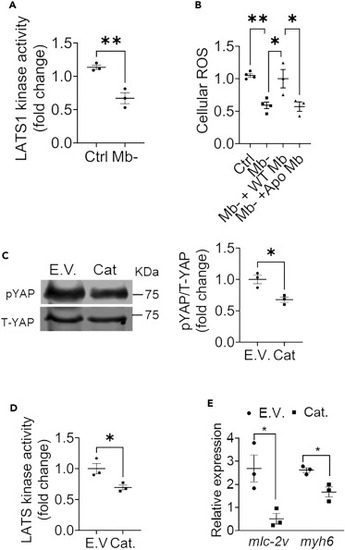
Scavenging H2O2 inhibits LATS1 activity (A) LATS1 kinase activity of immunoprecipitated LATS1 from control and Mb− cells. N = 3. (B) Cellular H2O2 levels in control, Mb−, Mb− cells with Mb overexpression and Apo-Mb overexpression; N = 3–4. (C) Representative western blot and quantification for pYAP and T-YAP levels in H9C2 cells transduced with empty vector (Ad E.V.) or with adenoviral catalase (Ad Cat) expression; N = 3. (D) LATS1 kinase activity in empty vector (Ad E.V.) or adenoviral catalase (Ad Cat) transduced H9C2 cells; N = 3. (E) Relative expression of mRNA of cardiac differentiation markers in cells overexpressing empty vector control and catalase adenovirus compared with undifferentiated cells; N = 3. Data are mean ± SEM. ∗p < 0.05, ∗∗p < 0.01. |

Loss of Mb promotes cardiomyocyte proliferation and regeneration in vivo (A) Western blot and quantification of Mb in WT and mb−/− zebrafish hearts; N = 3 biological replicates. (B) Representative western blot and quantification of pYAP and T-YAP WT and mb−/− zebrafish hearts; N = 3. (C) Zebrafish heart section demonstrating the staining for de-differentiation marker embCMHC in red and α-sarcomeric actin in green at 7 days post amputation, and quantification of embCMHC cardiomyocytes (Differentiation index: % of cardiomyocytes expressing embCMHC in border zone of injury) from WT and mb−/− hearts; N = 3 from each group. Scale bar: 100 μm. (D) Heart sections from WT and mb−/− zebrafish stained for Mef2c transcription factor (red) to identify cardiomyocytes and PCNA (green) to identify proliferating cells at 7 days post amputation: N = 7–9 individual zebrafish per group. Scale bar: 100 μm. (E) Representative histological sections of AFOG stained tissue from WT and mb−/− zebrafish at 20- and 30-days post amputation stained to visualize fibrin (red), collagen (blue) and cardiac muscle (orange). Graph demonstrates the quantification of scar area on each section normalized to total ventricular area; N = 9–16 individual zebrafish per group. Scale bar: 100 μm. Data are mean ± SEM. ∗p < 0.05, ∗∗p < 0.01, ∗∗∗∗p < 0.0001. |
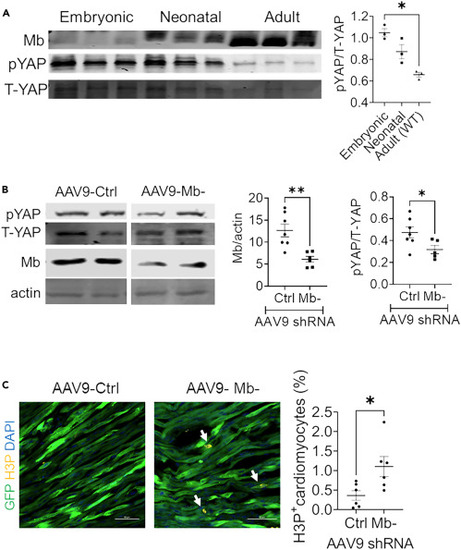
Deletion of Mb inhibits YAP phosphorylation in neonatal mouse hearts (A) Western blot and relative quantification of pYAP to T-YAP ratios in embryonic (E14.5), fetal (postnatal day 3) and adult (10-week-old) mice. N = 3 mice per age. (B) Representative western blot and relative quantification of pYAP to T-YAP ratios in postnatal day 7 mouse hearts after injection of AAV9 virus encoding a scramble control or Mb targeting shRNA into postnatal day 1 mice. N = 5–7 mice per group. (C) Representative tissue sections and quantification of phospho histone 3 (H3P) staining from mice injected with control or Mb− targeted shRNA expressing AAV9. N = 6 mice per group. Arrow indicates H3P+ nuclei and green represents the GFP cardiomyocytes infected with AAV9. Scale bar: 50 μm. Data are mean ± SEM. ∗p < 0.05, ∗∗p < 0.01. |
|