
- Title
-
1H NMR metabolomics insights into comparative diabesity in male and female zebrafish and the antidiabetic activity of DL-limonene
- Authors
- Benchoula, K., Serpell, C.J., Mediani, A., Albogami, A., Misnan, N.M., Ismail, N.H., Parhar, I.S., Ogawa, S., Hwa, W.E.
- Source
- Full text @ Sci. Rep.
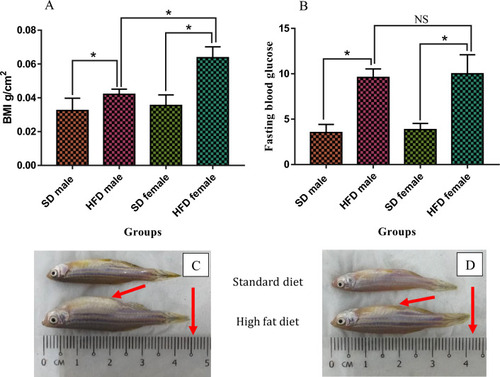
BMI (g/cm2) and fasting blood glucose level (mmol/L) of zebrafish following over-feeding with HFD and standard diet for 4 weeks. Values are means (± SD), (* PHENOTYPE:
|
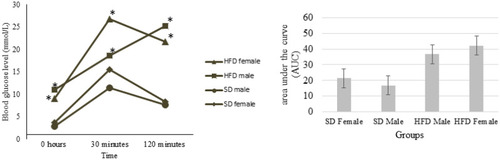
Glucose tolerance test (GTT) and area under the curve (AUC) of male and female zebrafish fed an HFD versus SD. Blood glucose levels were measured after fasting for 0, 30, and 120 min, and following an oral dose of 1.25 mg glucose/g body weight; Values are means (± SD), (* PHENOTYPE:
|
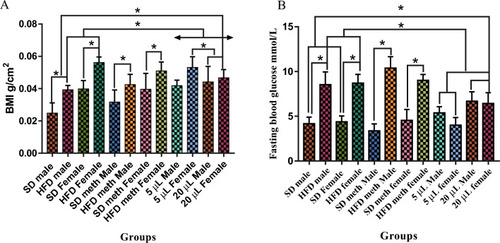
BMI ( PHENOTYPE:
|
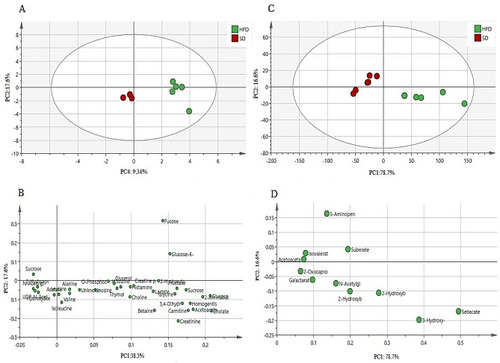
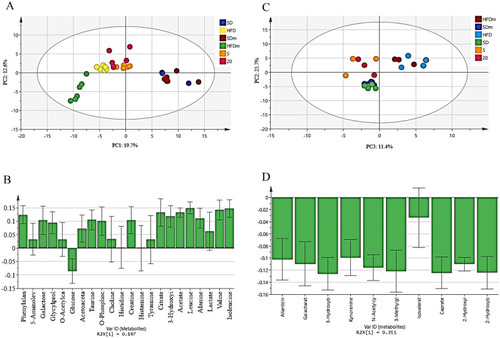
The PCA score ( PHENOTYPE:
|
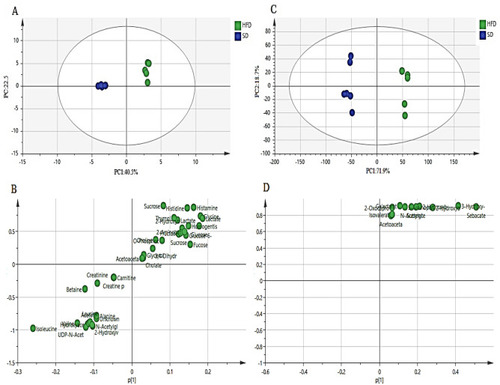
The OPLS-DA score plot ( PHENOTYPE:
|
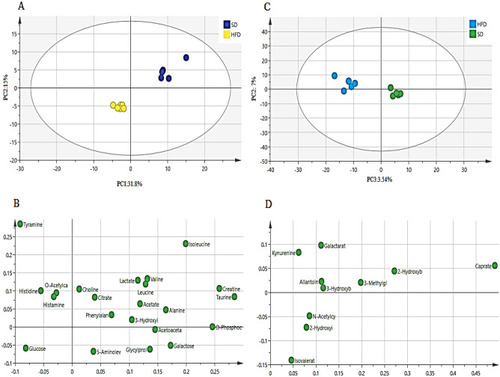
The PCA score ( PHENOTYPE:
|
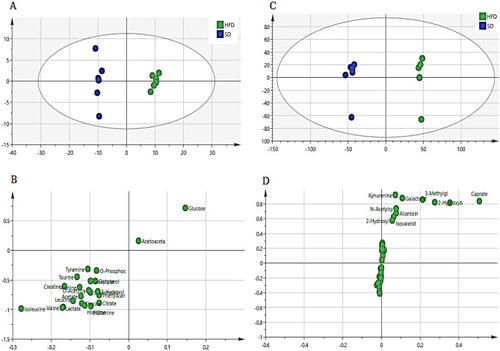
The OPLS-DA score plot ( PHENOTYPE:
|
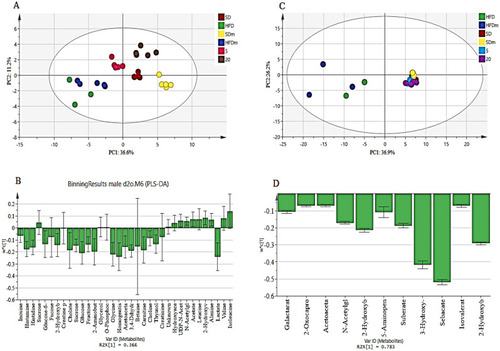
The PLS-DA score ( PHENOTYPE:
|
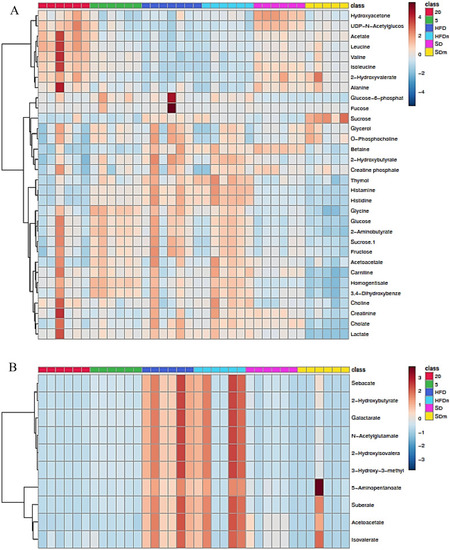
The heatmap of aqueous ( PHENOTYPE:
|
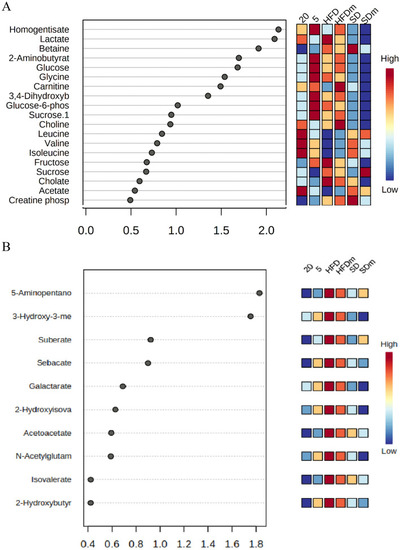
The VIP values were derived from PLS-DA of aqueous ( PHENOTYPE:
|
The PLS-DA score ( PHENOTYPE:
|
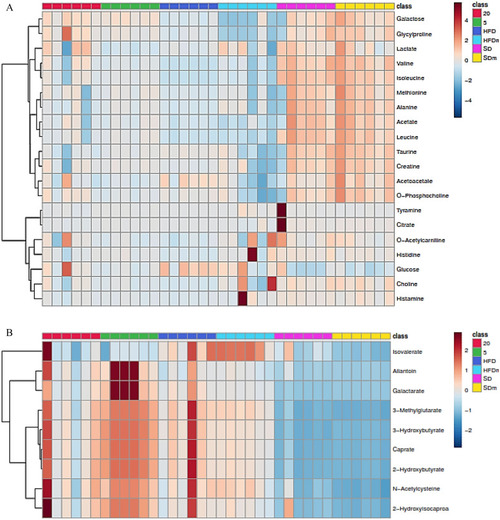
The heatmap of aqueous ( PHENOTYPE:
|
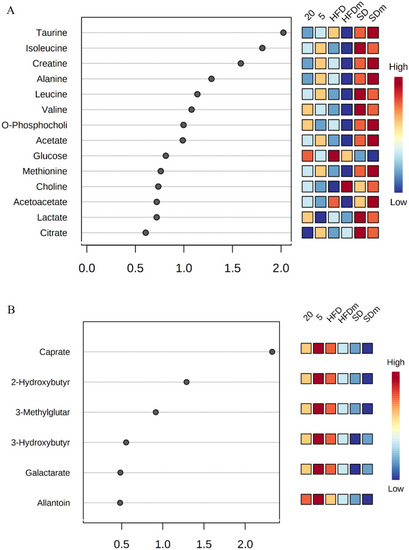
The VIP values were derived from PLS-DA of aqueous ( PHENOTYPE:
|
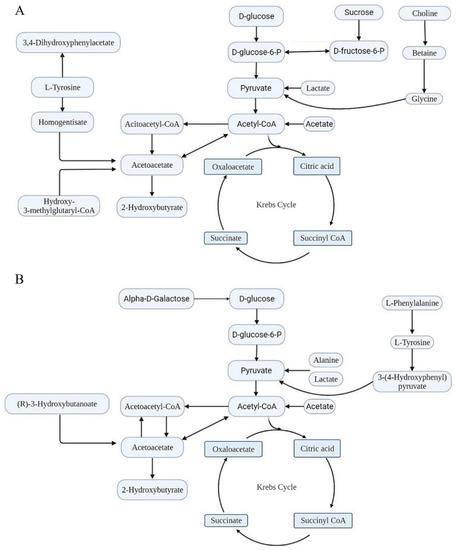
Metabolic pathways and metabolite changes observed in diabetic ( |
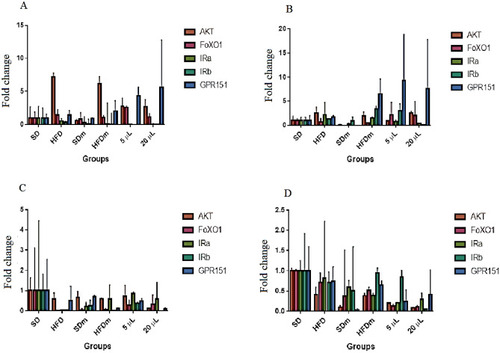
The foldchange of the tested liver ( |