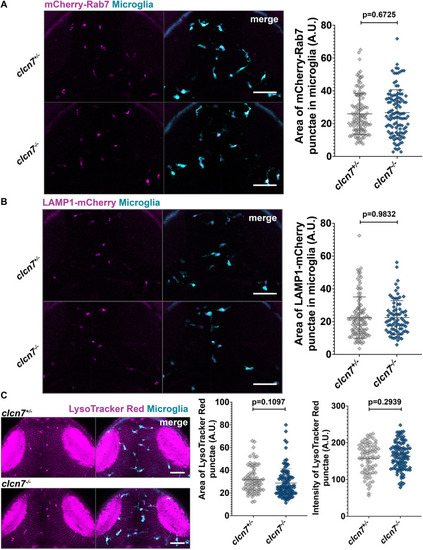
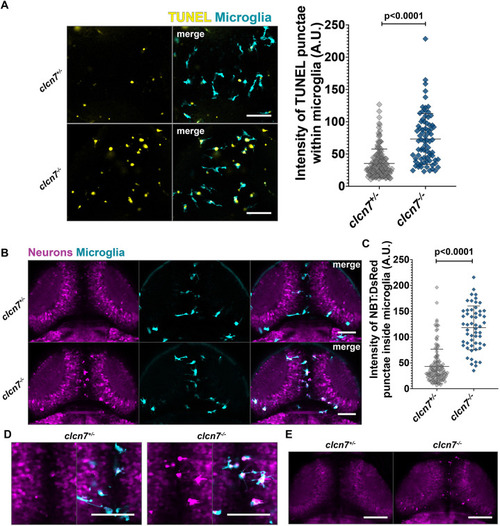
Reduced Neutral Red staining in clcn7 and ostm1 mutants. (A,B) Neutral Red labeling revealed significantly fewer microglia labeled with this vital dye in (A) clcn7 and (B) ostm1 mutants. Some mutants displayed small Neutral Red punctae (gray arrows). These smaller Neutral Red punctae were included in the quantification. clcn7+/+: n=9, mean=33.9, s.d.=5.2, s.e.m.=1.7. clcn7+/−: n=28, mean=33.1, s.d.=4.9, s.e.m.=1.0. clcn7−/−: n=10, mean=10.7, s.d.=8.2, s.e.m.=2.6. ostm1+/+: n=14, mean=33.5, s.d.=4.9, s.e.m.=1.3. ostm1+/−: n=28, mean=32.2, s.d.=5.6, s.e.m.=1.1. ostm1−/−: n=13, mean=5.5, s.d.=5.8, s.e.m.=1.6. Two-tailed unpaired t-test with Welch's correction was performed to calculate significance; graphs show mean±s.d. (C) apoe in situ hybridization showed that clcn7 and ostm1 mutants have normal numbers and morphology of microglia. (D) Confocal microscopy confirmed that mpeg1:GFP expression is normal in clcn7 and ostm1 mutants. Images in A, B and D are representative of at least three independent experiments, and those in C of two independent experiments. Scale bars: 50 µm.

Late endosomal and lysosomal compartments appear normal in clcn7 mutants. Transgenic expression of (A) mCherry-Rab7 and (B) LAMP1b-mCherry driven under the control of mpeg1 regulatory sequences was similar in clcn7 heterozygotes and mutants. mCherry-Rab7; clcn7+/−: n=17, mean=26.0, s.d.=12.6, s.e.m.=1.1. mCherry-Rab7; clcn7−/−: n=8, mean=26.7, s.d.=14.0, s.e.m.=1.3. LAMP1b-mCherry; clcn7+/−: n=18, mean=22.5, s.d.=12.6, s.e.m.=1.2. LAMP1b-mCherry; clcn7−/−: n=8, mean=22.5, s.d.=10.3, s.e.m.=1.2. (C) Area and intensity of LysoTracker Red were similar between clcn7 heterozygotes and mutants. clcn7+/− area: n=14, mean=31.8, s.d.=11.6, s.e.m.=1.3. clcn7−/− area: n=17, mean=28.8, s.d.=12.8, s.e.m.=1.3. clcn7+/− intensity: n=14, mean=157, s.d.=41.1, s.e.m.=4.7. clcn7−/− intensity: n=17, mean=163.3, s.d.=37.5, s.e.m.=3.7. Two-tailed unpaired t-test with Welch's correction was performed to calculate significance; graphs show mean±s.d. Images are representative of two independent experiments. Scale bars: 50 µm. A.U., arbitrary units.

Microglia are unable to effectively clear endogenous debris in clcn7 mutants. (A) TUNEL assay revealing a significantly greater intensity of apoptotic punctae inside the microglia of clcn7 mutants (n=6, mean=73.3, s.d.=39.2, s.e.m.=4.5) than in clcn7 heterozygotes (n=12, mean=35.5, s.d.=22.2, s.e.m.=1.8). (B) Microglia in clcn7 mutants show an accumulation of NBT:DsRed neuronal punctae. (C) The intensity of DsRed punctae inside microglia was significantly greater in clcn7 mutants (n=13, mean=118, s.d.=42.4, s.e.m.=5.7) relative to clcn7 heterozygotes (n=29, mean=43.2, s.d.=33.4, s.e.m.=2.9). (D) High magnification image showing accumulation of neuronal debris inside microglia. (E) Low magnification image showing accumulation of NBT:DsRed punctae in the midbrain, where microglia are enriched. Images are representative of at least three independent experiments. Two-tailed unpaired t-test with Welch's correction was performed to calculate the significance in all graphs; graphs show mean±s.d. Scale bars: 50 µm. A.U., arbitrary units.

Exogenous debris accumulates inside microglia and macrophages of clcn7 mutants. (A) E. coli Texas Red particles injected in the ducts of Cuvier accumulate inside peripheral macrophages. The intensity of Texas Red particles inside the macrophages is greater in clcn7 mutants (n=8, mean=156.2, s.d.=68.8, s.e.m.=8.5) than in clcn7 heterozygotes (n=27, mean=80.2, s.d.=82.3, s.e.m.=5.1). Arrows indicate macrophages containing little or no E. coli in control animals. Scale bars: 50 µm. (B) Zymosan A injected into the midbrain of zebrafish larvae to observe microglia response. Microglia in clcn7 mutants and heterozygotes respond similarly to inflammatory stress. Yellow asterisks mark the site of injection. Images are representative of two independent experiments. Scale bars: 20 µm. (C) β-amyloid (1–42) HiLyte Fluor-555 particles injected into the midbrain of zebrafish larvae accumulate inside the microglia of clcn7 mutants (n=16, mean=71.7, s.d.=50.3, s.e.m.=4.6) to a significantly greater extent than in clcn7 heterozygotes (n=26, mean=40.5, s.d.=42.5, s.e.m.=3.0). Scale bars: 50 µm. Two-tailed unpaired t-test with Welch's correction was performed to calculate the significance in all graphs; graphs show mean±s.d.

Acknowledgments
This image is the copyrighted work of the attributed author or publisher, and ZFIN has permission only to display this image to its users. Additional permissions should be obtained from the applicable author or publisher of the image. Full text @ J. Cell Sci.