
- Title
-
Cyclin F can alter the turnover of TDP-43
- Authors
- Rayner, S.L., Hogan, A., Davidson, J.M., Chapman, T., Cheng, F., Luu, L., Wu, S., Zhang, S., Yang, S., Blair, I., Morsch, M., Chung, R., Lee, A.
- Source
- Full text @ Neurobiol. Dis.
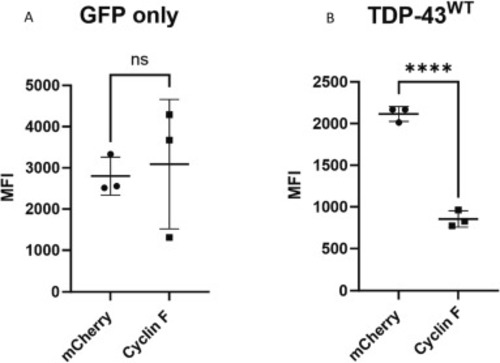
Cyclin F overexpression leads to the downregulation of TDP-43. A. Cyclin F does not downregulate GFP. B. Cyclin F downregulates GFP-tagged TDP-43WT. All data represent the average GFP mean fluorescence intensity (MFI) along with SD. N = 3. A Student's t-test was performed to determine significance. ****p ≤ 0.0001, ns; not significant. |
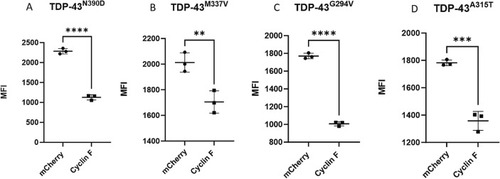
Cyclin F depleted multiple TDP-43 variants. Flow cytometry analysis of cyclin F effect on protein levels of: A. TDP-43N390D, B. TDP-43M337V, C. TDP-43G294V and D. TDP-43A315T. All data represent the GFP Mean Fluorescent Intensity (MFI) along with SD in mCherry expressing cells analysed by flow cytometry. N = 3. A Student's t-test was performed to determine significance. **p ≤ 0.01. ***p ≤ 0.001, ****p ≤ 0.0001, ns; not significant. |
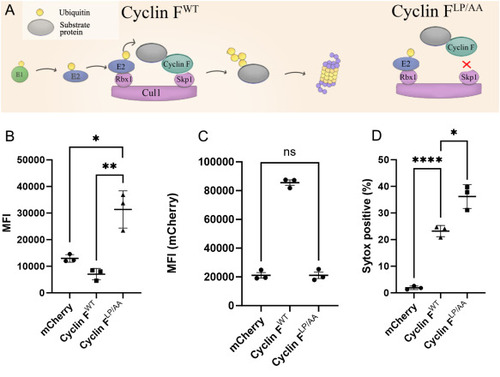
Impact of cyclin F enzymatic activity on TDP-43 depletion and cell toxicity. A. Comparison of cyclin FWT and cyclin FLP/AA ubiquitylation cascade. Cyclin FWT can associate with the SCF complex leading to the ability to mediate ubiquitylation of substrates whilst cyclin FLP/AA has reduced association with the SCF complex and thereby has reduced enzymatic activity. B. Effect of mCherry, mCherry-cyclin FWT and mCherry-cyclin FLP/AA on TDP-43-GFP MFI. C. Expression of mCherry constructs. D. Effects of cyclin F enzymatic activity on the percentage of SYTOX positive cells. A Student's t-test was performed to determine significance. N = 3. *p ≤ 0.05, **p ≤ 0.01., ****p ≤ 0.0001, ns; not significant. All data represent the mean along with SD. |
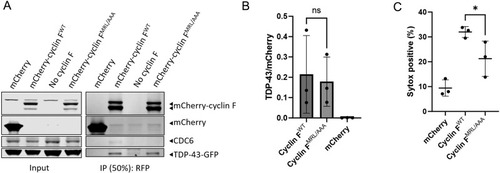
The interaction between cyclin F and TDP-43 is unique. A. The interaction between cyclin F and TDP-43 was maintained when cyclin F carried the cyclin FMRL/AAA mutation. IP represents 50% of eluents. B. Densitometry results of TDP-43 co-immunoprecipitated with cyclin FWT or cyclin FMRL/AAA shown in A. Data represent abundance of co-immunoprecipitated TDP-43 normalised to abundance of immunoprecipitated cyclin F. A student's t-test was used to determine significance. ns; not significant. Results represent the mean and SD from triplicate analyses. C. Flow cytometry evaluation of the effect of cyclin F on inducing SYTOX-positive cells. For all results, N = 3. A Student's t-test was performed to determine significance. *p ≤ 0.05, ns; not significant. Results represent the mean and SD from triplicate analyses. |
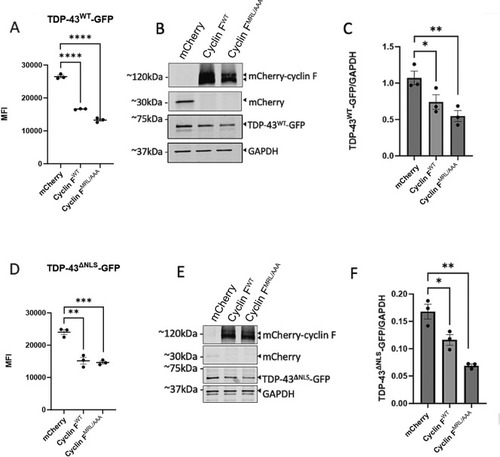
Mutant cyclin F can deplete TDP-43. A. Flow cytometry evaluation of effect of cyclin FWT, cyclin FMRL/AAA or mCherry on TDP-43-GFP MFI. B. Western blot evaluation of effect of cyclin FWT, cyclin FMRL/AAA or mCherry on TDP-43 abundance. C. Densitometry analysis of immunoblots shown in B. D. Flow cytometry evaluation of effect of cyclin FWT, cyclin FMRL/AAA or mCherry on TDP-43ΔNLS-GFP MFI. E. Western blot evaluation of effect of cyclin FWT, cyclin FMRL/AAA or mCherry on TDP-43ΔNLS-GFP MFI. F. Densitometry analysis of immunoblots shown in E. For all data, graphs represent the mean and SD. N = 3. *p ≤ 0.05, **p ≤ 0.01, ***p ≤ 0.001, ****p ≤ 0.0001. |
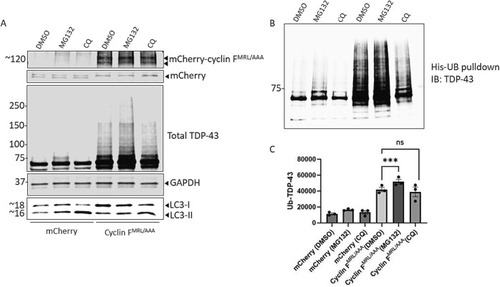
Mutant cyclin F promotes TDP-43 degradation through the proteasome. A. HEK293T cells were triple transfected with TDP-43-GFP, His-ubiquitin and mCherry-cyclin F or empty vector control. Cells were treated with either 10 μM MG132 or 10 μM Chloroquine (CQ) for 4 h before lysis. Lysates were analysed by immunoblotting using the antibodies indicated. B. His-ubiquitin pull-downs (His-UB pulldown) from lysates (shown in A) were conducted under denaturing conditions. Eluents were analysed by immunoblotting using an antibody recognising TDP-43. C. Densitometry analysis of TDP-43 bands results from B. N = 3. Results represent the mean and SD. ***p ≤ 0.001, ns; not significant. |
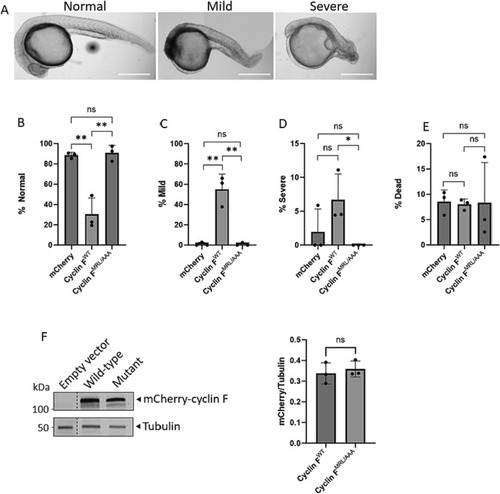
Cyclin FMRL/AAA does not increase developmental abnormalities in zebrafish. A. Representative images of zebrafish at 24 h post fertilisation demonstrating typical morphology of embryos classified as normal, mild and severe abnormalities. Scale bar = 500 μm. B. Quantification of normal embryo morphology at 24 hpf following injection with mCherry, mCherry-cyclin FWT or mCherry-cyclin FMRL/AAA mRNA. C. Quantification of embryos with mild abnormalities at 24 hpf. D. Quantification of embryos with severe abnormalities at 24 hpf. E. Quantification of non-viable embryos at 24 hpf. F. Equal expression of cyclin F in mCherry-cyclin FWT and mCherry-cyclin FMRL/AAA groups was confirmed by western blot followed by densitometry using ImageJ, confirming differences observed between groups were not a result of differing levels of overexpression. All graphs represent mean with SD of three independent experiments. An unpaired t-test was used to determine statistical significance. *p ≤ 0.05, **p ≤ 0.01, ns; not significant. The western blot has been spliced as indicated by the dotted lines. |