
- Title
-
Perturbed development of calb2b expressing dI6 interneurons and motor neurons underlies locomotor defects observed in calretinin knock-down zebrafish larvae
- Authors
- Iglesias Gonzalez, A.B., Koning, H.K., Tuz-Sasik, M.U., van Osselen, I., Manuel, R., Boije, H.
- Source
- Full text @ Dev. Biol.

Overall characterization of calb2beGFP transgenic line. A) Dorsal and lateral light-sheet images of the calb2beGFP transgenic line at 3 days post fertilization (dpf). B) Dorsal and lateral view of the spinal cord at 3 dpf. calb2beGFP positive primary and secondary motor neurons labelled by are indicated by white arrowheads. C) Confocal image with details of the lateral line from head to spinal cord at 3 dpf. D) Whole mount immunohistochemistry against calretinin in calb2beGFP larvae at 3 dpf. E) Quantification of eGFP-positive cells in calb2beGFP larvae from 2 to 4 dpf. Scale bar, 100 μm in A and B; 50 μm in C and D. |

Colocalization of calb2beGFP with dI6-dmrt3a and motor neurons. A) Dorsal view of calb2beGFP; dmrt3aRFP cell bodies and fiber layer at 3 days post fertilization (dpf). Arrowheads indicate overlapping cells and arrows the axon of the CoLo subtype. B) Lateral view of calb2aeGFP; mnx1RFP at 3 dpf. Asterisks mark primary motor neurons and arrowheads mark secondary motor neurons. C) Percentage of calb2beGFP that are colocalized with primary and secondary motor neurons, Evx2 and dI6-dmrt3a interneurons. D) Quantification of calb2aeGFP; mnx1RFP motor neurons by position in the dorso-ventral axis and soma size at 3 dpf. pMN – primary motor neuron, sMN – secondary motor neuron. Scale bar, 50 μm in A, B, C, D and G; 25 μm in zoom boxes in A, B and D. |

A minor cellular phenotype in calb2b knock-down larvae. A) Brightfield images of control and calb2b knock-down larvae reveal no physical phenotype at 3 days post fertilization (dpf). B) Immunohistochemistry against calretinin at 3 dpf show a significant diminished number of calretinin positives cells. C) Quantification of calretinin positive cells in calb2b knock-down larvae compared to controls. D) Confocal images of dmrt3aRFP in control and calb2b knock-down larvae. E) Quantification of dmrt3aRFP cells in control larvae and calb2b knock-down larvae. F) Confocal images of mnx1RFP in control and calb2b knock-down larvae. G) Quantification of mnx1RFP cells in the control larvae and calb2b knock-down larvae. H) Confocal images of Evx2 positive cells in control and calb2b knock-down larvae. I) Quantification of Evx2 positive cells in control and calb2b knock-down larvae. Scale bar, 100 μm in all images. Statistical differences: >0.05 (ns), ≤0.05 (*), ≤0.01 (**), ≤0.001 (***) and ≤0.0001 (****). |

Calretinin deficient larvae displayed a reduced amount of dmrt3aRFP cells. A) Brightfield images of calb2a, calb2b double morphants versus controls at 3 days post fertilization (dpf). B) Confocal images of immunohistochemistry against calretinin in controls and calretinin knock-down larvae. C) Confocal images showing dmrt3aRFP transgenic line in control and calretinin knock-down larvae at 3 dpf. D) Confocal images showing dmrt3aRFP transgenic line in control and calretinin knock-down larvae at 6 dpf. Arrowheads indicate CoLo axons. E) Quantification of dmrt3aRFP at 3 dpf. F) Quantification of dmrt3aRFP at 6 dpf. Scale bar, 50 μm. Statistical differences: >0.05 (ns), ≤0.05 (*), ≤0.01 (**), ≤0.001 (***) and ≤0.0001 (****). |

Calretinin deficient larvae displayed a developmental delay of motor neurons. A) Confocal images of motor neurons, marked by mnx1RFP, from 1 to 3 days post fertilization (dpf) in control and calretinin knock-down larvae. B) Number of motor neurons per hemi-segment from 1 to 6 dpf in controls and calretinin knock-down larvae. C) Length of the CaP axon in control and calretinin knock-down larvae from 1 to 6 dpf. Scale bar, 100 μm. Statistical differences: >0.05 (ns), ≤0.05 (*), ≤0.01 (**), ≤0.001 (***) and ≤0.0001 (****). |

Analysis of locomotor behavior in calretinin knock-down larvae during swims and escapes. A) Parameters indicating swimming performance, (total distance, maximum acceleration, and mean velocity, at 4, 6 and 10 days post fertilization (dpf) during the free swimming in controls and calretinin knock-down larvae. B) Distance moved, maximum acceleration and maximum velocity during escape responses at 4, 6 and 10 dpf in freely moving control and calretinin knock-down larvae. C) Probability density distributions of fictive swim frequency in spontaneous and optomotor response evoked swims in 5–6 dpf calretinin knock-down larvae (N = 9, n = 1323) and control larvae (N = 6, n = 788). D) Example of a regular swim of a control larvae. E) Example of simultaneous contralateral bursting in a calretinin knock-down larvae. F) Example of inconsistent burst duration and amplitude in a calretinin knock-down larvae. G) Example of a generally incoherent swim in a calretinin knock-down larvae. H) Representative example of a stereotyped C-start escape swim in a control larvae consisting of a 100ms fast phase (>30Hz) followed by a slow phase (<30Hz). I) Calretinin knock-down larvae (N = 7, n = 135) showed a lack of fast swim speeds during the initial phase of a C-start escape compared to control larvae (N = 4, n = 86) (P < 0.005). J) Duration of C-start escape swims is shorter for calretinin knock-down larvae (P < 0.01). K) Example of qualitatively altered escape swim in calretinin knock-down larvae consisting of a short period of strongly lateralized activity. L-M) Examples of calretinin knock-down larvae escapes that show no (L) or reduced (M) activity during the supposed fast phase of the escape swim. Statistical differences: >0.05 (ns), ≤0.05 (*), ≤0.01 (**), ≤0.001 (***) and ≤0.0001 (****). |

|

Quantification of the number of calretinin cells in 2 days post fertilization calb2beGFP larvae. We detected calretinin in 147 out of 199 GFP-positive cells within the spinal cord. N = 6 larvae. Scale bar, 25 μm in all images. |

Whole-mount Immunohistochemistry revealing calretinin protein in a 6dpf larva. Scale bar, 25 μm in all images. N = 10 larvae analyzed. |

A) Quantification of the number of cells per segment in calb2beGFP, dmrt3aRFP double transgenic larvae revealing the number of positive cells and the overlap between them from 2 to 4 days post fertilization (dpf). B) Immunohistochemistry against wt1a on top of calb2beGFP transgenic larvae showed no overlap between the calb2beGFP cells (arrow) and wt1a immunoreactivity (arrowhead). C) Immunohistochemistry against evx2 on top of calb2beGFP transgenic line showed overlap between the marked cells (arrowhead). D) Motor neurons recovery from the phenotype in calretinin knock-down larvae at 6 dpf. Scale bar, 100 μm in all images. |
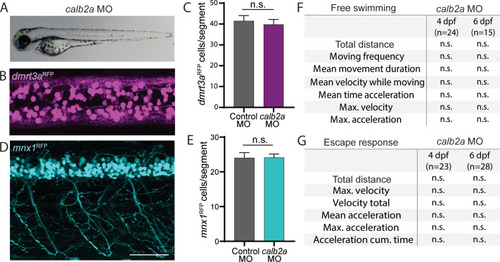
A) Brightfield images of calb2a morpholino injected larvae versus controls at 3 days post fertilization (dpf). B) Confocal images showing dmrt3aRFP in calb2a morphant larvae at 3 dpf. C) Quantification of dmrt3aRFP positive cells in control and calb2a morphant larvae at 3 dpf. D) Mnx1RFP transgenic line in calb2a morphant larvae at 3 dpf. E) Quantification of mnx1RFP positive cells in control and calb2a morphant larvae at 3 dpf. F) Analysis of free swimming of control larvae compared to calb2a morphants at 4 and 6 dpf. G) Analysis of escapes responses of control larvae compared to calb2a morphants at 4 and 6 dpf. Scale bar, 50 μm. Statistical differences: >0.05 (ns), ≤0.05 (*), ≤0.01 (**), ≤0.001 (***) and ≤0.0001 (****). |

A) left: Brightfield images of calb2a + calb2b sgRNA injected larvae at 3 days post fertilization (dpf), showing a severe phenotype (top) and a mild/mosaic phenotype (bottom). Right: Confocal images of dmrt3aGFP in severe (top) and mild/mosaic (bottom) phenotypical larvae. B) Genomic FLA primers. C) Table displaying the PCR fragment lengths detected following FLA-analysis for two control larvae (controls) and four phenotypical sgRNA injected larvae (crispants). Fragment Lengths found in control larvae are made bold. |
Reprinted from Developmental Biology, 508, Iglesias Gonzalez, A.B., Koning, H.K., Tuz-Sasik, M.U., van Osselen, I., Manuel, R., Boije, H., Perturbed development of calb2b expressing dI6 interneurons and motor neurons underlies locomotor defects observed in calretinin knock-down zebrafish larvae, 778777-87, Copyright (2024) with permission from Elsevier. Full text @ Dev. Biol.