
- Title
-
Using Electroporation to Improve and Accelerate Zebrafish Embryo Toxicity Testing
- Authors
- Tazin, N., Stevenson, T.J., Bonkowsky, J.L., Gale, B.K.
- Source
- Full text @ Micromachines (Basel)
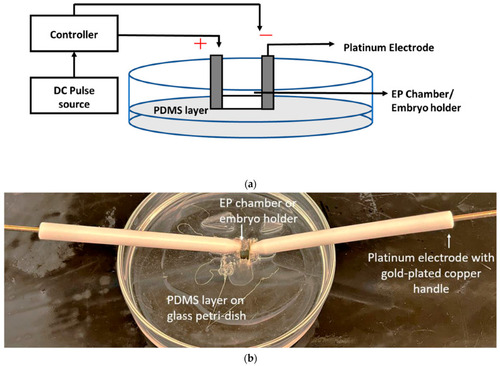
( |
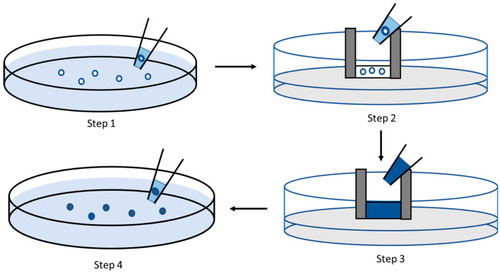
Flow diagram of using the electroporation system. Step 1: Collecting embryos from a Petri dish. Step 2: Placing the embryos in the chamber of the chip. Step 3: Applying Trypan blue or a toxic solution to the chamber and applying an electric field. Step 4: After electroporation, the embryos are transferred to a Petri dish. |
( |

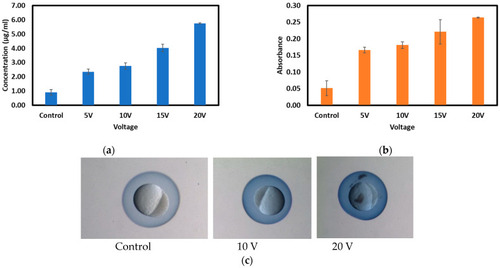
AuNPs inside the chorion of the embryos after exposure for 5 h ( |

( |

Control experiments: ( |
Application of electric field: ( |
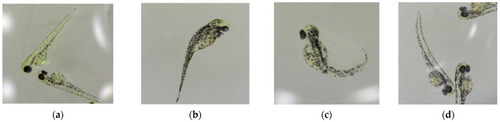
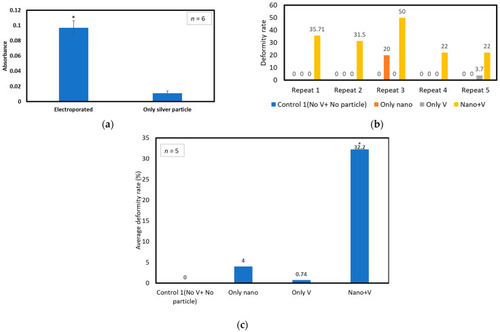
Deformities observed from exposure to 10nm AgNPs for 40 min after electroporation ( |
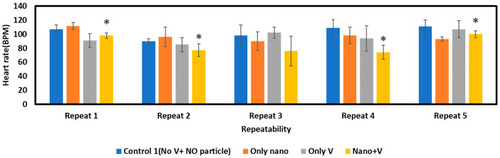
Condition of heart rate for exposure to 10nm AgNPs for 40 min. “*” indicates statistically significant difference ( |
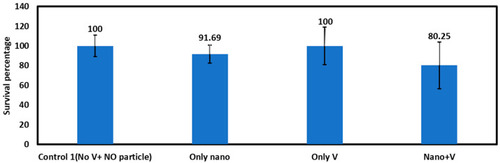
Survival rate for exposure of 10nm AgNPs for 40 min after electroporation (N = 5). |