
- Title
-
Role of melanocortin system in the locomotor activity rhythms and melatonin secretion as revealed by agouti-signalling protein (asip1) overexpression in zebrafish
- Authors
- Godino-Gimeno, A., Leal, E., Chivite, M., Tormos, E., Rotllant, J., Vallone, D., Foulkes, N.S., Míguez, J.M., Cerdá-Reverter, J.M.
- Source
- Full text @ J. Pineal Res.
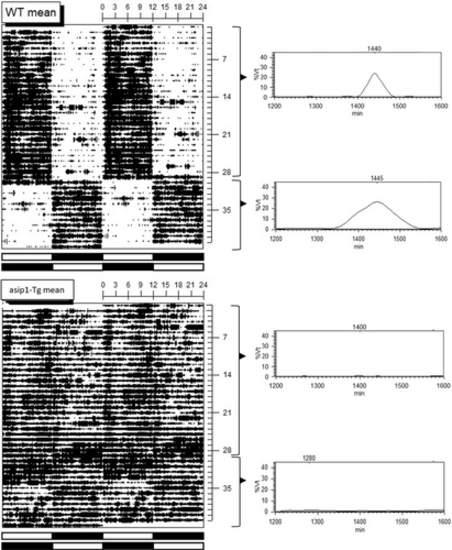
Charts (left) show the actograms of locomotor activity of wild-type (WT) (top) and asip1-Tg (bottom) animals maintained under a constant LD photoperiod for 28 days. Subsequently, the LD cycle was inverted (DL) and locomotor activity screened for 12 days. Actograms are presented in a dual-plot format (48 h time scale) to facilitate visualisation. Horizontal bars at the bottom represent periods of daylight (in white) and night (in black) for 2 consecutive days. The x-axes indicate time of day (h) and y-axes indicate time (days). Charts (right) show periodogram analysis providing the periodicity of the data with tau values close to 1440 m (24 h) for WT animals under LD and DL. No periodicity was detected in asip1-Tg animals. |
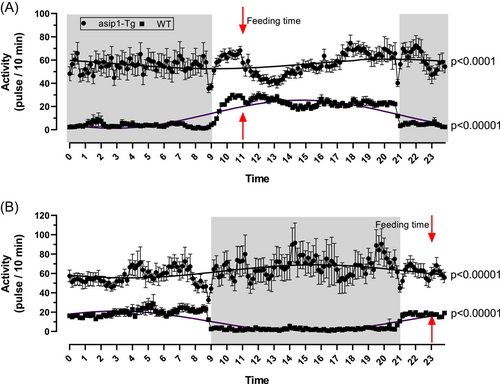
The average waveform of locomotor activity (LA) for adult asip1-Tg and wild-type zebrafish kept under constant LD (A) or DL (B) photoperiods. LA was recorded by infrared sensors for 28 consecutive days and pulses were integrated every 10 min. Each point represents the mean ± SEM (Standard Error of the Mean) of three 6 L tanks with 10 animals for each genotype. Rhythmicity was checked by cosinor fit run in El Temps v 1.313 (http://el-temps.com) and Cosinor Online (https://cosinor.online/app/cosinor.php) software. The p value of the fit is given on the right. The red arrow and grey charts indicate the feeding times and scotophase of the photoperiod, respectively. |
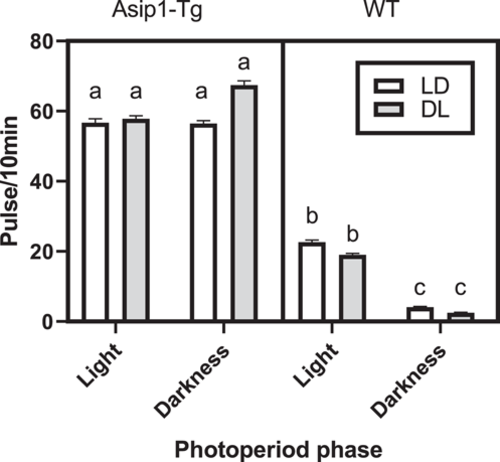
Total average locomotor activity (LA) of asip1 Tg (left chart) and wild-type (right chart) animals kept under LD (28 days) and subsequently inverted DL (12 days) photoperiod during the light and darkness phases. Different letter indicates significant differences after two-way analysis of variance (p < .05). See Figure 2 for further details. |
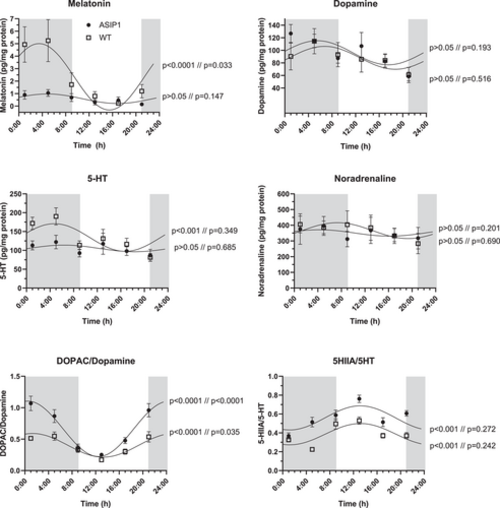
Neurotransmitters and melatonin daily rhythms of asip1 Tg and wild-type animals (n = 10) kept under constant LD photoperiod for 30 days. Grey bars indicate the dark phase of the photoperiod. Each point represents the mean ± SEM (n = 10). Differences among sampling times of the same genotype were assessed by one-way analysis of variance (ANOVA) and average values fitted to Cosinor curves. Significance values for each analysis are given close to the cosinor curves (ANOVA//Cosinor). |

Neurotransmitters and melatonin average levels of asip1 Tg and wild-type animals (n = 60) kept under constant LD for 30 days. * indicates significant differences after t test (p < .05). |
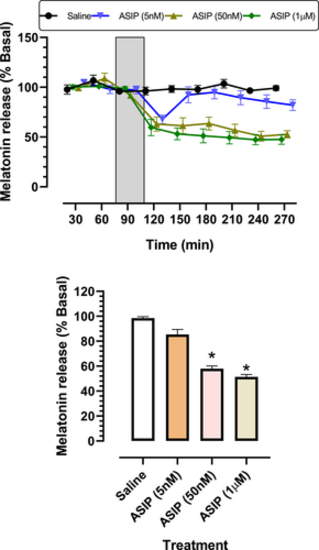
Top chart shows melatonin levels secreted from pineal glands superperfused with a constant flow rate of 5 µL/min with saline or melatonin. Fractions were collected at 30 min intervals. Each point represents the mean ± SEM (saline and 1 mM n = 5, 5 and 50 nM n = 6). Grey bar indicates superfusion period. Experiments were performed in triplicate. Bottom chart displays average levels of melatonin release from pineal glands after superfusion. Each bar represents the mean ± SEM (n = 10) from all collected fractions (saline and 1 mM n = 45, 5 and 50 nM n = 54). |
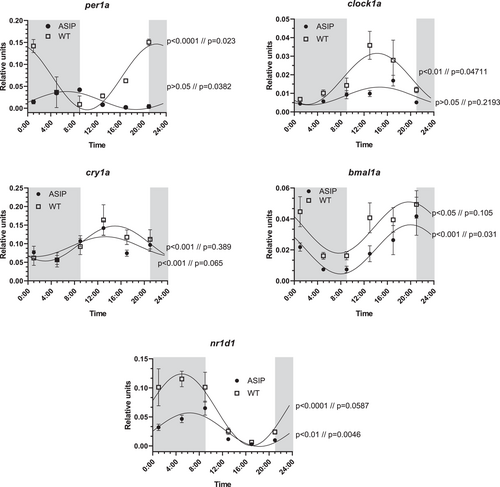
Daily rhythms of clock gene expression of asip1 Tg and wild-type animals (n = 10) kept under constant LD photoperiod (12 L/12D, lights on/off at 9 and 21 h, respectively) for 30 days. Grey bars indicate the dark phase of the photoperiod. Each point represents the mean ± SEM (n = 10). Difference among sampling times of the same genotype were assessed by one-way analysis of variance (ANOVA) and average values fitted to Cosinor curves. Significance values for each analysis are given close to the Cosinor curves (ANOVA//Cosinor). |
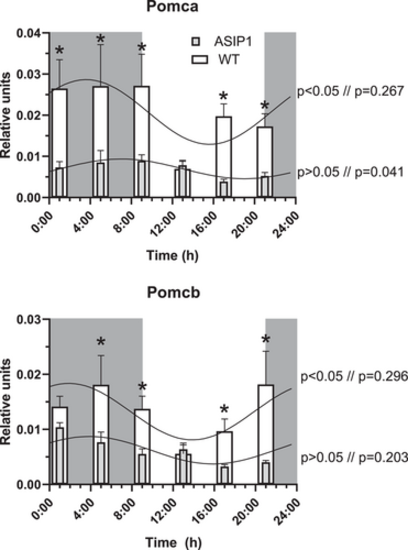
Daily rhythms of Pomc a (top) and Pomc b (bottom) encephalic expression of asip1 Tg and wild-type animals (n = 10) kept under constant LD photoperiod for 30 days. Grey bars indicate the dark phase of the photoperiod. Each point represents the mean ± SEM (n = 10). Difference among sampling times of the same genotype were assessed by one-way analysis of variance (ANOVA) and average values fitted to Cosinor curves. Significance values for each analysis are given close to the Cosinor curves (ANOVA//Cosinor). |