FIGURE SUMMARY
Title

Angiopoietin 1 and integrin beta 1b are vital for zebrafish brain development

Authors
Chen, Y.C., Martins, T.A., Marchica, V., Panula, P.
Source
Full text @ Front. Cell. Neurosci.

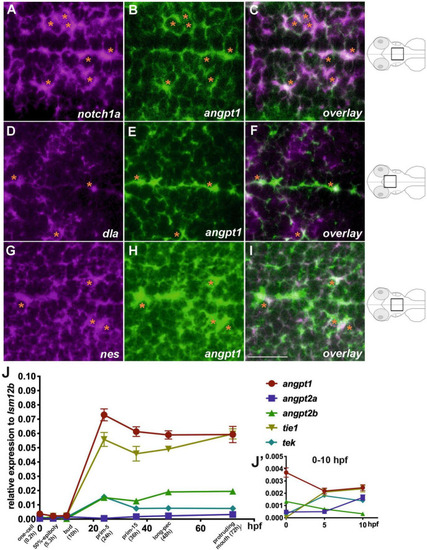
Co-localization of angpt1 with neurogenic markers in midline proliferative zone (shown schematically on the right). Double FISH in 2-dpf brain on 1.0 um thick optical sections using antisense RNA probes simultaneously hybridized against notch1a(A) and angpt1(B) and the overlay pattern of (A,B) is shown in (C). Double FISH in the 2-dpf brain using antisense RNA probes against dla(D) and angpt1(E), and the overlay pattern of (D,E) is shown in (F). Double FISH in 2-dpf brain using antisense RNA probes against nes(G) and angpt1(H), and the overlay pattern of (G,H) is shown in (I). Dynamic expression of angiogenic factors through the one-cell stage to 72 hpf by qPCR is shown in (J). P = 0.0428. (J’) Expression of angiogenic factors from 0 hpf to 10 hpf. Images are stacks of merged Z-slices. Tangerine stars indicate angpt1-positive cells co-localized with notch1a, dla, and nes-expressing cells. Statistical analysis of the qPCR result is shown in mean ± SD (N = 3 groups per stage, 20–30 embryos in one group) by Kruskal–Wallis test with Dunn’s multiple comparisons test. Scale bar is 20 μm.

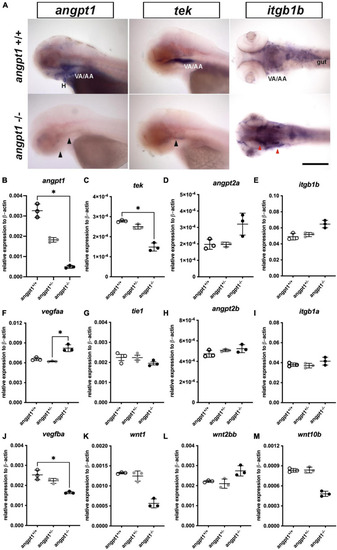
mRNA expression levels of angiogenic factors in 3-dpf angpt1–/– larvae. (A) Expression patterns of angpt1, tek, and itgb1b in 3-pf angpt1+/+ and angpt1–/– larvae done by WISH. Quantification of mRNA levels done by qPCR using 3-dpf angpt1+/+, angpt1±, and angpt1–/– larvae shown in (B)angpt1; (C)tek; (D)angpt2a; (E)itgb1b; (F)vegfaa; (G)tie 1; (H)angpt2b; (I)itgb1a F; (J)vegfba(K)wnt1; (L)wnt2bb; (M)wnt10b level. Samples were genotyped with HRM analysis. N = 6 per group for WISH. N = 3 Replications for qPCR in each genotyped group (10-pooled embryos in one replication). H, heart; VA/AA, ventral aorta/branchial arch. Arrows indicate regions showing differential expression patterns between angpt1+/+ and angpt1–/– larvae, the black one indicating downregulation and the red one showing upregulation. Statistical analysis of qPCR results is shown in mean ± SD by Kruskal–Wallis test with Dunn’s multiple comparisons test. *p < 0.05. Scale bar is 200 μm.

mRNA expression levels of neurogenesis markers in 3-dpf angpt1–/– larvae. (A) Expression patterns of notch1a, nestin (nes), and apoeb in 3-pf angpt1+/+ and angpt1–/– larvae done by WISH. Quantification of mRNA levels done by qPCR using 3-dpf angpt1+/+, angpt1± and angpt1–/– larvae shown in (B)notch1a; (C)nestin; (D)pax5; (E)pcna; (F)sox2; (G)th1; (H)th2; (I)hdc; (J)gfap; (K)apoea; (L)apoeb; (M) Quantification of apoeb-positive cell numbers in the midbrain, N = 6, P = 0.0001. Samples were genotyped with HRM analysis. N = 6 per group for WISH. N = 3 For qPCR, replications in each genotyped group (10-pooled embryos in one replication). ALLG, anterior lateral line ganglion; hb, hindbrain; mhb, midbrain-hindbrain boundary; ov, otic vesicle; Pr, pretectum. Black arrows indicate regions showing decreased expression in angpt1–/– compared with angpt1+/+ larvae. Red arrows indicate regions showing increased angpt1–/– expression compared with angpt1+/+ larvae. Statistical analysis of qPCR results is shown in mean ± SD by the Kruskal–Wallis test with Dunn’s multiple comparisons test. Statistical analysis of apoeb+ cell numbers is shown in mean ± SD by unpaired Student t-test. *p < 0.05, ***p < 0.001. Scale bar is 200 μm.

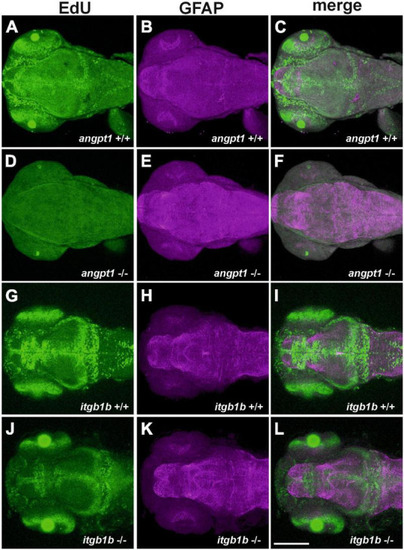
Decreased proliferation and increased gfap intensity in angpt1–/– and itgb1b–/– larvae. Maximum intensity projections of confocal z-stack images were made by immunostaining GFAP following the EdU proliferation assay in 3-dpf genotyped larvae. EdU labeling results shown in (A)angpt1+/+(D)angpt1–/–(G)itgb1b+/+ and (J)itgb1b–/– larval brains. gfap-immunoreactivity results shown in (B)angpt1+/+(E)angpt1–/–(H)itgb1b+/+ and (K)itgb1b–/– larval brains. The merge images of Edu-labeling and gfap-positive are shown in (C)angpt1+/+(F)angpt1–/–(I)itgb1b+/+ and (L)itgb1b–/– larval brains. Proliferating cells are indicated in green, and gfap-positive signals are in magenta. N = 5 per genotyped group. Scale bars are 200 μm.

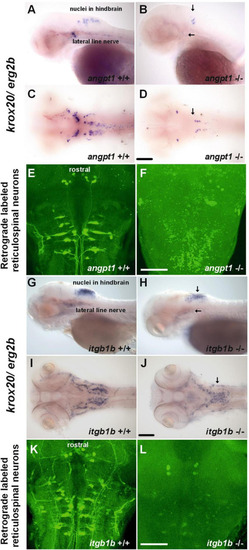
Deficiencies of reticulospinal neurons in angpt1–/– and itgb1b–/– larval hindbrain. Expression of krox20 mRNA done by WISH shown in (A) lateral view and (C) dorsal view of 3-dpf angpt1+/+ and (G) lateral view and (I) dorsal view of 4-dpf itgb1b+/+ larvae. Fainter and misexpression patterns of krox20 were found in (B) lateral view and (D) dorsal view of 3-dpf angpt1–/– brain and in (H) lateral view and (J) dorsal view of 4-dpf itgb1b–/– brain. Retrograde labeling of 4-dpf genotyped larvae reveals the deficiencies of reticulospinal neurons in (F)angpt1–/– and (L)itgb1b–/– brains compared with their (E)angpt1+/+ and (K)itgb1b+/+ siblings. N = 5 per genotyped group in WISH and retrograde labeled analysis. Arrows indicate the abnormality of krox20 expression patterns in the angpt1–/– and itgb1b–/– hindbrain and lateral line nerves. Scale bars are 200 μm.

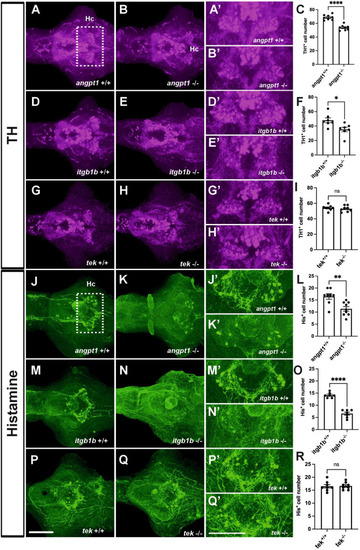
Deficient dopaminergic and histaminergic neurons are found in angpt1–/– and itgb1b–/– brains but normally developed in tek–/– brains. TH1-immunostaining images of 4-dpf shown in (A)angpt1+/+(B)angpt1–/–(C) Quantification of TH1-positive cell numbers in the Hc region (N = 8 per group, P < 0.0001) (D)itgb1b+/+(E)itgb1b–/–(F) Quantification of TH1-positive cell numbers in the Hc region (N = 7 per group, P = 0.0153) (G)tek+/+(H)tek–/– and (I) Quantification of TH1-positive cell numbers in the Hc region (N = 8 per group, P = 0.5392). Histamine (His)-immunostaining images of 4-dpf show in (J)angpt1+/+(K)angpt1–/–(L) Quantification of His-positive cell numbers in the Hc region (N = 8–9 per group, P = 0.003) (M)itgb1b+/+(N)itgb1b–/–(O) Quantification of His-positive cell numbers in the Hc region (N = 7 per group, P < 0.0001) (P)tek+/+(Q)tek–/– and (R) Quantification of His-positive cell numbers in the Hc region (N = 8 per group, P = 0.8814). (A’–Q’) Show the high magnification images corresponding to the white rectangular area in the Hc region shown in (A) and an equivalent area in (B–Q). TH-positive cells display in magenta, and His-positive cells display in green. Hc, caudal hypothalamus. Data represent the mean ± SD. n unpaired student t-test was used for statistical analysis, *p < 0.05, **p < 0.01 and ****p < 0.0001. Scale bars are 200 μm.

Transgenic expression of zebrafish angpt1 increases proliferation and HuC-positive cells but reduces GABAergic neurons. 5-dpf dissected brains were collected from Turku wild-type embryos injected with Tol2 constructs, including control or angpt1 transgene driven by h2afx, elavl3, and gfap promoter at the one-cell stage. Brain samples were stained with anti-HuC and anti-GABA antibodies following the EdU assay. EdU-proliferation images shown in (A) control (B)h2afx: angpt1(C)elavl3: angpt1(D)gfap: angpt1(E) Quantification of EdU-positive cell numbers in the Hc region [N = 7–11 per injected group, F(3, 31) = 10.75 P < 0.0001]. HuC-immunostaining images shown in (F) control (G)h2afx: angpt1(H)elavl3: angpt1(I)gfap: angpt1(J) Quantification of HuC-positive cell numbers in the Hc region [N = 7–11 per injected group, F(3, 31) = 11.58, P < 0.0001]. GABA-immunostaining images show (K) control (L)h2afx: angpt1(M)elavl3: angpt1(N)gfap: angpt1(O) Quantification of GABA-positive cell numbers in the Hc region [N = 7–11 per injected group, F(3, 31) = 33.92, P < 0.0001]. (A’–N’) Show the high magnification images corresponding to the white rectangular area in the Hc region shown in (A) and equivalent in (B–N). EdU-positive cells are displayed in magenta, HuC-positive cells in cyan, and GABA-positive cells in green. Hc, caudal hypothalamus. Statistical analysis is shown in mean ± SD by an ordinary one-way ANOVA with the Tukey multiple comparisons test. *p < 0.05, **p < 0.01, ***p < 0.001 and ****p < 0.0001. Scale bar is 200 μm.

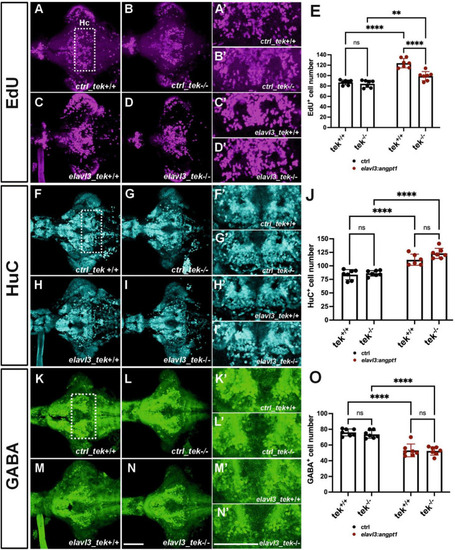
Zebrafish angpt1 regulates neurogenesis in a tek-independent manner. 5-dpf dissected brains were collected from tek+/+ and tek–/– embryos injected with Tol2 constructs including control, angpt1 transgene driven by h2afx, elavl3, or gfap promoter at one-cell stage. The brain samples were stained with anti-HuC and anti-GABA antibodies following the EdU assay. EdU-proliferation images shown in (A) control of tek+/+(B) control of tek–/–(C)tg(elavl3: angpt1) in tek+/+(D)tg(elavl3: angpt1) in tek–/–(E) Quantification of EdU-positive cell numbers in the Hc region (N = 7 per transgene-genotype group, genotype factor F(1, 24) = 23.43, P < 0.0001; transgene factor F(1, 24) = 82.89, P < 0.0001). HuC-immunostaining images show (F) control of tek+/+(G) control of tek–/–(H)tg(elavl3: angpt1) in tek+/+(I)tg(elavl3: angpt1) in tek–/–(J) Quantification of HuC-positive cell numbers in the Hc region [N = 7 per transgene-genotype group, genotype factor F(1, 23) = 4.501, P = 0.0449; transgene factor F(1, 23) = 92.70, P < 0.0001]. GABA-immunostaining images show (K) control of tek+/+(L) control of tek–/–(M)tg(elavl3: angpt1) in tek+/+(N)tg(elavl3: angpt1) in tek–/–(O) Quantification of GABA-positive cell numbers in the Hc region [N = 7–11 per transgene-genotype group, genotype factor F(1, 24) = 0.5009, P = 0.4859; transgene factor F(1, 24) = 98.17, P < 0.0001]. (A’–N’) Show the high magnification images corresponding to the white rectangular area in the Hc region shown in (A) and equivalent in (B–N). EdU-positive cells in magenta, HuC-positive cells in cyan, and GABA-positive cells in green. Hc, caudal hypothalamus. Statistical analysis is shown in mean ± SD by an ordinary two-way ANOVA with Sidak’s multiple comparisons test, with a single pooled variance. **p < 0.01 and ****p < 0.0001. Scale bar is 200 μm.

Acknowledgments
This image is the copyrighted work of the attributed author or publisher, and ZFIN has permission only to display this image to its users. Additional permissions should be obtained from the applicable author or publisher of the image. Full text @ Front. Cell. Neurosci.