FIGURE SUMMARY
Title

A Zebrafish Mutant in the Extracellular Matrix Protein Gene efemp1 as a Model for Spinal Osteoarthritis

Authors
Raman, R., Bahri, M.A., Degueldre, C., Caetano da Silva, C., Sanchez, C., Ostertag, A., Collet, C., Cohen-Solal, M., Plenevaux, A., Henrotin, Y., Muller, M.
Source
Full text @ Animals (Basel)

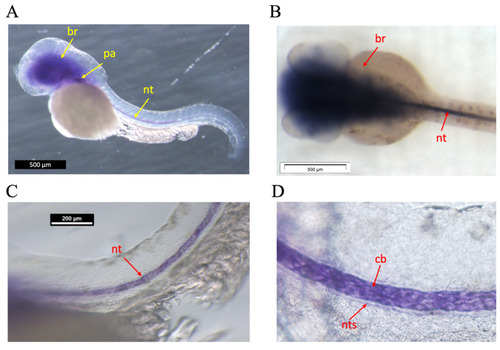
Whole mount in situ hybridization on 48 hpf zebrafish embryos. (A) Lateral view, anterior to the left. Expression is seen in the brain (br), the pharyngeal area (pa), and in the notochord (nt) (B) Dorsal view, anterior to the left. Dissection microscope picture. Expression is seen in brain and notochord. (C,D) Lateral views, anterior to the left. Enlarged view of expression in the notochord, specifically (D) in the chordoblasts (cb) immediately adjacent to the notochordal sheath (nts). Other, non-related probes served as negative control.

Cartilage staining with alcian blue of 5 dpf (A,C) and 10 dpf (B,D) wt and efemp1−/− mutant larvae. The different measures are illustrated in (A,B): d-ar: distance between the Meckel’s-palatoquadrate articulations; d-cer: distance between the posterior ends of the ceratohyals; a-cer: angle between the ceratohyals; hl: head length and d-hyo: head width. (C) efemp1−/− reveal a reduced distance between the articulation (d-ar) and narrower distance between the ceratohyal elements (d-cer) at 5 dpf compared to wt (wt n = 24, efemp1−/− n =21). (D) No difference in the cartilage elements in efemp1−/− at 10dpf compared to wt (wt n = 22, efemp1−/− n = 27). The graphs show the individual data points, the mean value ± SEM; significance: * p < 0.05 (unpaired student’s t-test).

Increased TMD in efemp1−/− mutants. (A) Representative µCT scans (MIPi = Maximum Intensity Projected image) of a 1.5-year-old wt (top) and efemp1−/− (bottom) adult. (B) Lateral view of pre-caudal vertebrae 6–8 (L to R) for the two groups; wt and efemp1−/−. The black arrow points to the decreased intervertebral distance and ruffled border. (C) Representative µCT scan of a vertebra in three planar views, showing the two morphometric measurements: vertebral thickness (µm) and vertebral length (µm). (D) Morphometric analysis comparing vertebral thickness and vertebral length of individual precaudal vertebral body numbers 6–8 (n = 6 fish/group) in efemp1−/− compared to wt. The values are expressed as mean ± SEM (standard error on mean), statistical significance as determined with ordinary one-way ANOVA test. (E) Line plots generated using the GraphPad Prism9 Software (v.9.4.1) of the data points obtained from the FishCuT Software revealing significantly increased TMDs in the entire vertebrae (Vert.TMD) and in the vertebral centra (Cent.TMD) of efemp1−/− adults relative to wt (p < 0.0001), with no significant differences observed in other combinatorial measures, (n = 6 fish/group and total no. of vertebrae analyzed = 25/individual). The values are expressed as mean ± SEM, significance: * p < 0.05, as determined via multiple linear regression analysis.

Reduced intervertebral disk space and bone spurs observed in the spine of efemp1−/− adult zebrafish. (A) Closeup view of pre-caudal vertebrae 6–8 (L to R) for wt and efemp1−/−, clearly showing reduced intervertebral disk space and bone spurs, indicated by yellow bar and arrowheads, respectively. (B) Intervertebral disk space calculated between vb06-vb07 and vb07-vb08 (n = 6 fish/group), revealing significant reduction of the intervertebral disk space in the efemp1−/− zebrafish adults. The values are expressed as mean ± SEM, significance: * p < 0.05, ** p < 0.01, as determined by ordinary one-way ANOVA test.

Acknowledgments
This image is the copyrighted work of the attributed author or publisher, and ZFIN has permission only to display this image to its users. Additional permissions should be obtained from the applicable author or publisher of the image. Full text @ Animals (Basel)