FIGURE SUMMARY
Title

SH2 domain protein E and ABL signaling regulate blood vessel size

Authors
Schumacher, J.A., Wright, Z.A., Rufin Florat, D., Anand, S.K., Dasyani, M., Batta, S.P.R., Laverde, V., Ferrari, K., Klimkaite, L., Bredemeier, N.O., Gurung, S., Koller, G.M., Aguera, K.N., Chadwick, G.P., Johnson, R.D., Davis, G.E., Sumanas, S.
Source
Full text @ PLoS Genet.

she mutants display pericardial edema and loss of blood circulation.

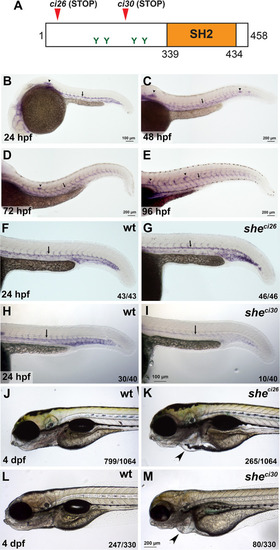
(A) Zebrafish SHE protein diagram. she ci26 and ci30 mutant alleles are predicted to result in a frameshift and premature stop codons. SH2 domain and consensus tyrosine ABL phosphorylation sites are shown. (B-E) In situ hybridization analysis of she expression in wild-type embryos at 24, 48, 72 and 96 hpf stages. Note its expression in the dorsal aorta (arrows), intersegmental vessels, lateral line primordium (arrowhead, B) and neuromasts (arrowheads, C-E). (F-I) In situ hybridization analysis of she expression in she mutants at 24 hpf. Note that she expression is unaffected in sheci26 embryos while it is strongly reduced in sheci30 embryos. Homozygous sheci26 mutant embryos were obtained by an incross of sheci26-/-; fli1a:she-2A-mCherry; kdrl:GFP parents (which are viable due to fli1a:she-2A-mCherry rescue) and selected for mCherry negative embryos. Wild-type control embryos were obtained by incross of sibling wt; fli1a:she-2A-mCherry parents and selected for mCherry-negative embryos. sheci30 embryos were obtained by incross of sheci30+/- parents and genotyped after in situ hybridization. 25% (10 out of 40) embryos showed strong reduction in she expression which correlated with the mutant phenotype. (J-M) Brightfield images of sheci26 and sheci30 mutant embryos and their siblings (wild-type and or heterozygous) at 4 dpf. Note the pericardial edema (arrowheads) in the mutant embryos. Embryos were obtained by the incross of heterozygous parents in kdrl:GFP background. 24.9% (265 out of 1064) and 24.2% (80 out of 330) embryos obtained in sheci26 or sheci30 incross, respectively, showed this phenotype. A subset of embryos was genotyped to confirm the correlation between the phenotype and genotype.

she mutants show enlarged diameter of the dorsal aorta.

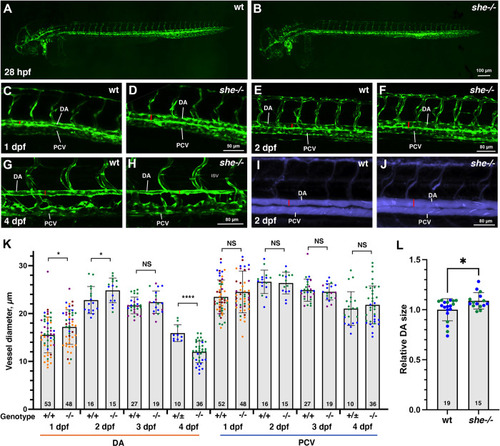
(A,B) Overall vascular patterning of she-/- mutants is normal when compared to their sibling wild-type embryos at 28 hpf. Embryos are in kdrl:GFP background. (C-F) A wider DA is observed in she mutant embryos compared to their wild-type (she+/+) siblings at 1 and 2 dpf (28 and 48 hpf respectively). Red line indicates DA diameter. (G,H) DA is narrower in she mutants at 4 dpf compared to their siblings. (I,J) Qtracker dots were injected into the circulatory system at 2 dpf (48 hpf) stage. Wider DA is apparent in she mutants (red lines), indicating enlarged vascular lumen size. (K) Diameter of the DA and PCV at 1–4 dpf in she mutants and their wild-type siblings. * p<0.05; ****p<0.0001, NS–not significant, Student’s t-test. Error bars show SD. Data were combined from 2 (2 dpf and 4 dpf), 3 (3 dpf) or 5 (1 dpf) replicate experiments; data points from each replicate experiment are shown in different colors. (L) Quantification of DA lumen size based on the imaging of embryos injected with Qtracker dots. Relative DA size was calculated by dividing each value over an average lumen size in wt embryos. *p<0.05, Student’s t-test. Data were combined from 2 replicate experiments, shown in different colors. Error bars show SD. At all stages, she mutant and sibling embryos were obtained by in-crossing sheci26+/-; kdrl:GFP carriers. Embryos at 1 and 2 dpf were genotyped after imaging. Embryos at 4 dpf were separated based on the phenotype, and wild-type siblings include she+/+ and she+/- embryos at this stage. Numbers at the bottom of the bars indicate the total number of embryos analyzed.

she overexpression in vasculature reduces the diameter of the dorsal aorta and rescues the she mutant phenotype.

(A-C) Quantification of trunk vasculature in wild-type and fli1:she-2A-mCherry embryos in kdrl:GFP background at 28 hpf. Confocal imaging of GFP expression in live embryos obtained from stable transgenic lines; the diameter of the DA is marked with red line. Note the reduction of DA diameter in fli1:she-2A-mCherry embryos compared to wild-type non-transgenic (mCherry-) siblings. Embryos were obtained by incross of she+/+ (referred to as wild-type); fli1:she-2A-mCherry+/- parents and separated based on mCherry expression. (D-F) Quantification of trunk vasculature in she-/- and she-/-; fli1:she-2A-mCherry embryos at 28 hpf. The diameter of the DA is marked with red line. Note that the DA diameter is reduced in she-/-; fli1:she-2A-mCherry embryos compared to she siblings without the transgene (mCherry-). Embryos were obtained by incross of she-/-; fli1:she-2A-mCherry+/- parents and separated based on mCherry expression. Note that wild-type and she-/- mCherry- embryos in (C and F) cannot be directly compared in this experiment because they came from different parents and are not siblings; embryos from different pairs can show significant variability in the DA diameter. (G,H) Pericardial edema in she-/- mutants (G) is rescued in she-/-; fli1:she-2A-mCherry embryos at 4 dpf. (I) Percentage of she mutant embryos showing pericardial edema at 4 dpf. Note that vascular endothelial expression of full length She (fli1:she-2A-mCherry) and the construct carrying a deletion of the SH2 domain in She protein (fli1:sheΔSH2-2A-mCherry) rescues the mutant phenotype, while overexpression of She construct with SH2 domain alone (fli1:sheSH2-2A-mCherry) fails to rescue the phenotype. ****p<0.0001, NS–not significant, Fisher’s exact test, compared to she no transgene embryos. (J) Injection of fli1:she-2A-mCherry DNA plasmid together with tol2 mRNA results in mosaic expression of she-2A-mCherry in endothelial cells. Note that mCherry positive segments of the DA (arrows) show reduced diameter compared to adjacent mCherry-negative segments (arrowheads). (K) Quantification of the DA diameter in mCherry+ and mCherry–DA segments. In all graphs, error bars show SD; *p<0.05, **p<0.01, ****p<0.0001, Student’s t-test. 3 replicate experiments were performed in A-H, and 2 replicate experiments were performed in I-K; data points from separate replicate experiments are shown in different colors.

she affects cell number and inhibits endothelial cell proliferation.

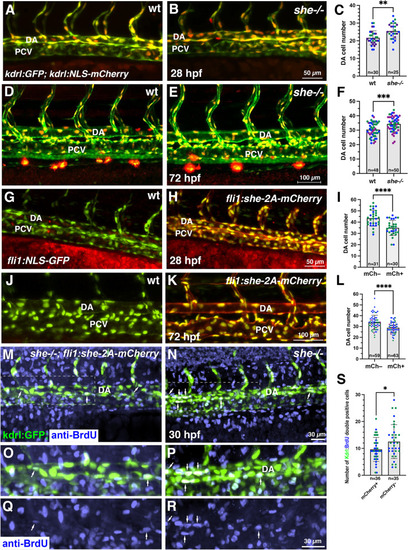
(A-F) Analysis of cell number in the DA of she mutant and wild-type (she+/+) sibling embryos at 28 and 72 hpf. Embryos were obtained from an incross of she+/-; fli1:GFP; kdrl:NLS-mCherry parents, imaged by confocal microscopy and subsequently genotyped. Note increased cell number in she mutant embryos. (G-L) Analysis of cell number in the DA of fli1:she-2A-mCherry; fli1:NLS-GFP embryos and their mCherry negative (wt) siblings at 28 and 72 hpf. Note the reduced cell number in mCherry+ embryos. (M-S) Cell proliferation analysis using BrdU incorporation assay in she-/-; fli1:she-2A-mCherry embryos (phenotypically normal) and their sibling mCherry negative she-/- embryos in kdrl:GFP background at 30 hpf. (O-R) show enlarged view of the area in insets (M,N). Note the increased number of BrdU and kdrl:GFP double positive cells within the DA in mCherry-negative she mutant embryos. All graphs show data combined from 2 (I,S) or 3 (C,F,L) independent experiments; data points from different experiments are shown in distinct colors. Mean±SD is shown. *p<0.05, **p<0.01, ***p<0.001, ****p<0.0001, Student’s t-test.

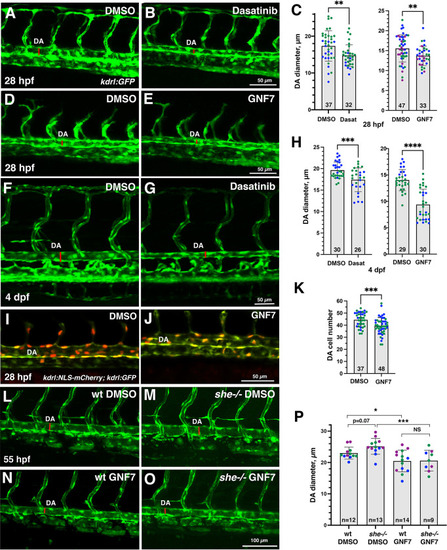
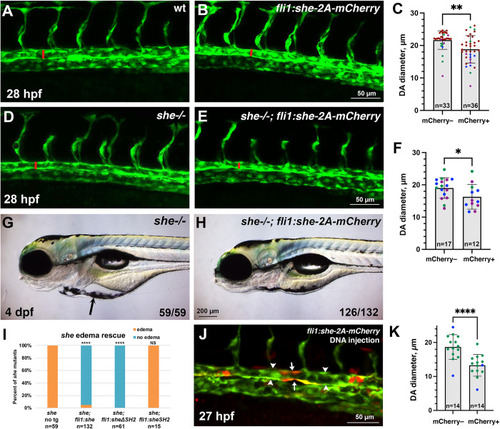
Inhibitors of Abl signaling reduce DA diameter in wild-type and she mutant embryos.

(A-E) Dorsal aorta diameter at 28 hpf is reduced in kdrl:GFP embryos treated with 5 μM Dasatinib or 1 μM GNF-7 compared to controls treated with 0.1% DMSO. (F-H) Embryos treated with 5 μM Dasatinib (F-H, left) or 1 μM GNF-7 (H, right) exhibit narrower DA at 4 dpf compared to controls treated with 1% DMSO (GNF-7) or 2% DMSO (Dasatinib treatments). (I-K) The number of cells in the DA is reduced in embryos at 28 hpf treated with 1 μM GNF-7 compared to control embryos treated with 0.1% DMSO. (L-O) GNF-7 treatment reverses DA enlargement in she mutant embryos. she+/-; kdrl:GFP adults were crossed to obtain she mutant embryos. Embryos were treated starting at 6 hpf with either 0.5 μM GNF-7 or 0.1% DMSO. Embryos were imaged at approximately 55 hpf and subsequently genotyped. DA measurements were performed blinded. Mid-trunk region is shown, anterior is to the left. Note the slightly wider DA (red line) in she-/- mutant embryos compared to wild-type (she+/+) siblings. DA is reduced in both wild-type and she mutant embryos treated with GNF-7. (P) Quantification of DA diameter in wild-type or she mutant embryos treated with GNF-7 or DMSO. In all graphs mean±SD is shown. Data points (shown in different colors) are combined from 2 (left graph C,H,K) or 3 (right graph C,P) independent experiments. Total number of embryos analyzed is shown at the bottom of each bar. *p<0.05, **p<0.01, ***p<0.001, ****p<0.0001, NS–not significant, Student’s t-test (C,H,K), or one-way ANOVA test, followed by multiple comparisons Fisher’s LSD (P).

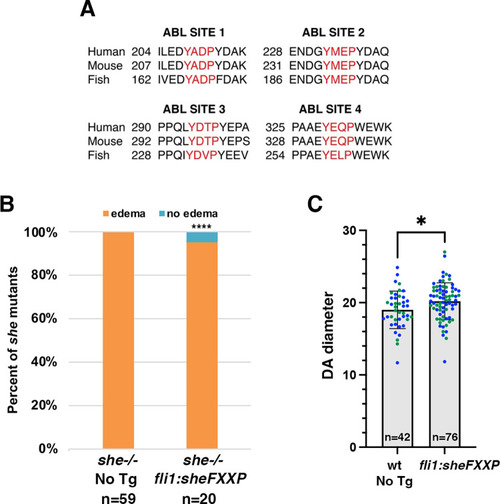
Consensus ABL phosphorylation sites YXXP are required for SHE function.

(A) Consensus ABL phosphorylation sites are conserved between zebrafish, mice and humans. (B) Vascular endothelial expression of a mutant construct fli1:sheFXXP-2A-mCherry, where all four consensus tyrosines have been substituted into phenylalanine, fails to rescue the pericardial edema in she mutants at 4 dpf. The first bar showing she-/- embryos (no Tg) is copied from Fig 3I. ****p<0.0001, Fisher’s exact test. (C) DA diameter measurement (μm) in fli1:sheFXXP-2A-mCherry embryos and sibling mCherry-negative embryos at 28 hpf. 5 measurements were performed in each embryo, which were then averaged for statistical calculations. 2 replicate experiments were performed, shown in different colors. n corresponds to the number of embryos. Mean ± SD is shown. *p<0.05, Student’s t-test.

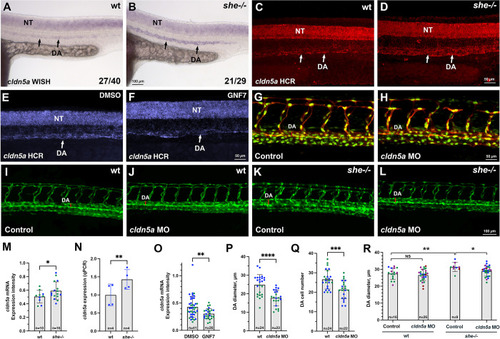
She regulates vascular lumen size by inhibiting cldn5a expression.

(A-D) Chromogenic whole mount in situ hybridization (WISH) (A,B) and fluorescent in situ hybridization analysis using hybridization chain reaction (HCR) (C,D) analysis for cldn5a expression in she mutants and sibling wild-type (she+/+) embryos at 24 hpf. Note increased cldn5a expression in the dorsal aorta (DA) in she mutants while neural tube (NT) expression is unaffected. Quantification of cldn5a expression in the DA is shown in (M). Embryos were obtained by incross of heterozygous she parents and genotyped after WISH or HCR. (E,F) HCR analysis for cldn5a expression in control 0.01% DMSO or 1 μM GNF7 treated kdrl:GFP embryos. Trunk region is shown, anterior is to the left. Note the reduction in cldn5a expression in the DA while neural tube expression is unaffected. Quantification is shown in (O). (G,H) 2 ng cldn5a MO injection reduces DA size (red line across the DA) and DA cell number in kdrl:mCherry; fli1:NLS-GFP embryos at 28 hpf. Quantification is shown in (P,Q). (I-L) 1 ng dose cldn5a MO injection reduces enlarged DA in she mutants. Embryos were obtained by an incross of she+/-; kdrl:GFP parents and imaged for GFP expression at 2 dpf. Mid-trunk region is shown, anterior is to the left. Quantification is shown in (R). Note the increase in DA width (red line) in she mutants (K), which is reduced upon cldn5a MO injection (L). (M) Quantification of cldn5a expression in the DA of she mutants and wild-type siblings after HCR fluorescent in situ hybridization at 24 hpf. To reduce the staining variability between different embryos, expression values in the DA were normalized to the neural tube expression in each embryo. Expression analysis was performed blindly without knowledge of embryo genotypes. Datapoints have been combined from two independent experiments, shown in different colors. Mean±SD shown. *p<0.05, Student’s t-test. (N) qPCR analysis of cldn5a expression in FACS-sorted vascular endothelial cells obtained from she mutant and wild-type embryos at 24 hpf. Expression was normalized to the house-keeping EF1a gene. Embryos were obtained by incross of she-/-; fli1:she-2A-mCherry+/- or she+/+ (wild-type); fli1:she-2A-mCherry+/- parents in kdrl:GFP background and sorted for the absence of mCherry. Mean±SD shown. **p<0.01, Student’s t-test. (O) Quantification of cldn5a expression in embryos treated with 0.01% DMSO or 1 μM GNF7 at 24 hpf. Relative expression in the DA was calculated by dividing the intensity in the DA over the expression intensity in the neural tube. Datapoints have been combined from two independent experiments, shown in different colors. Error bars show mean±SD. **p<0.01, Student’s t-test. (P,Q) Quantification of DA diameter (P) and DA cell number (Q) in embryos injected with 2 ng of cldn5a MO. Datapoints were combined from two independent experiments, shown in different colors. Mean±SD shown. ***p<0.001, ****p<0.0001, Student’s t-test. (R) Quantification of DA diameter at 2 dpf in wild-type and she mutant embryos injected with 1 ng cldn5a MO. Mean±SD shown. *p<0.05, ** p<0.01, NS–not significant, one-way ANOVA analysis, followed by multiple comparisons Fisher’s LSD test.

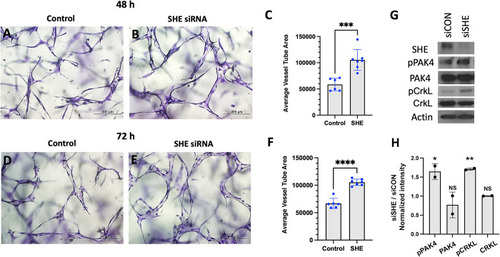
Inhibition of SHE in HUVECs results in enlarged tubulogenesis.

(A-F) HUVEC cells were transfected with either control or SHE siRNA and analyzed in 3D collagen matrix assay at 48 (A-C) or 72 h (D-F) after transfection. The values (± standard deviation) are derived from 6–7 representative fields from 3 replicate wells where total EC tube area was measured. *** p<0.001; ****p<0.0001, Student’s t-test. (G) Western blots for expression of SHE and phosphorylation of PAK4, and CRKL in HUVEC cells transfected with a control or SHE siRNA. Note greatly reduced SHE expression and increased pPAK4 and pCRKL in cells transfected with siSHE RNA. Analysis was done at 48hr after transfection except for pCRKL and CRKL, which are 72 hr. Two replicate experiments were performed; full results are shown in S11 Fig. (H) Relative intensity ratio in siSHE / siControl samples. Note increased intensity in pPAK4 and pCRKL samples compared to siControl (which equals to 1); *p<0.05, **p<0.01, Student’s t-test.

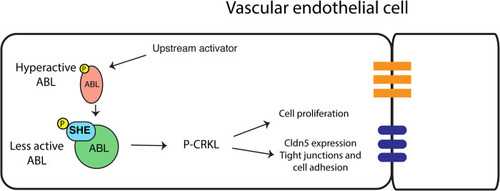
A proposed model for SHE and ABL signaling during vascular tubulogenesis.

Activated ABL promotes enlarged vascular lumen through a downstream effector P-CRKL which increases endothelial cell proliferation and increases Cldn5 expression, thus affecting tight junctions and cell adhesion. Activated ABL phosphorylates SHE, which then interacts with ABL to dampen its activity resulting in the lumen of appropriate size.

Acknowledgments
This image is the copyrighted work of the attributed author or publisher, and ZFIN has permission only to display this image to its users. Additional permissions should be obtained from the applicable author or publisher of the image. Full text @ PLoS Genet.