
- Title
-
Arginine vasopressin injection rescues delayed oviposition in cyp19a1b-/- mutant female zebrafish
- Authors
- Shaw, K., Lu, C., Liu, X., Trudeau, V.L.
- Source
- Full text @ Front Endocrinol (Lausanne)
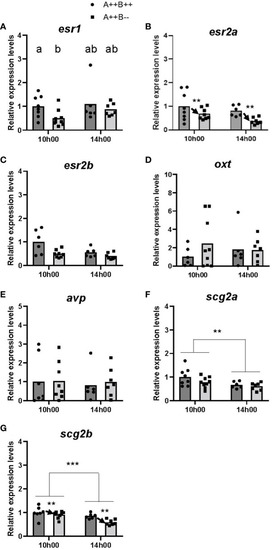
Gene expression in the telencephalon of adult wildtype (A++B++) and cyp19a1b-/- mutant (A++B–) female zebrafish in the morning (10h00) and afternoon (14h00). The abundance of mRNAs (copies/µL) for all genes measured was normalized by tata-binding protein levels within the sample and data are plotted as fold change relative to the wildtype female levels at 10h00. Parametric data were analyzed by Two-Way ANOVA tests followed by Tukey’s multiple comparisons tests and individual values are plotted with bars representing mean values |
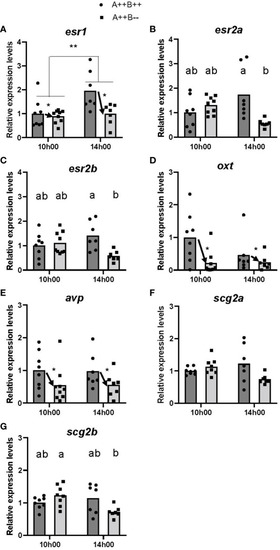
Gene expression in the hypothalamus of adult wildtype (A++B++) and cyp19a1b-/- mutant (A++B–) female zebrafish in the morning (10h00) and afternoon (14h00). The abundance of mRNAs (copies/µL) for all genes measured were normalized by tata-binding protein levels within the sample and data are plotted as fold change relative to the wildtype female levels at 10h00. Parametric data were analyzed by Two-Way ANOVA tests followed by Tukey’s multiple comparisons tests and individual values are plotted with bars representing mean values |
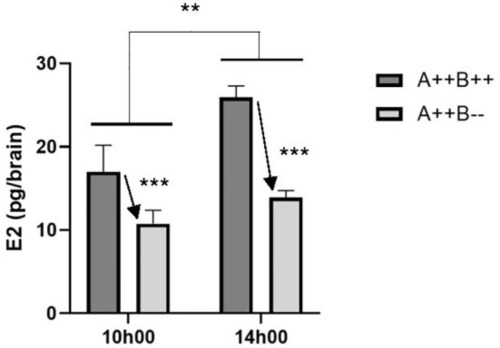
Estradiol (E2) levels in the brains of adult wildtype (A++B++) and cyp19a1b-/- mutant (A++B–) female zebrafish in the morning (10h00) and afternoon (14h00). Data were analyzed using a Two-Way ANOVA followed by Tukey’s multiple comparisons tests. Significant main effects of time (**, p=0.0072) and genotype (*** with arrow; p=0.0003) are indicated. There was no significant interaction effect. Data are plotted as means + standard error of the mean (n=4-5 per group). |
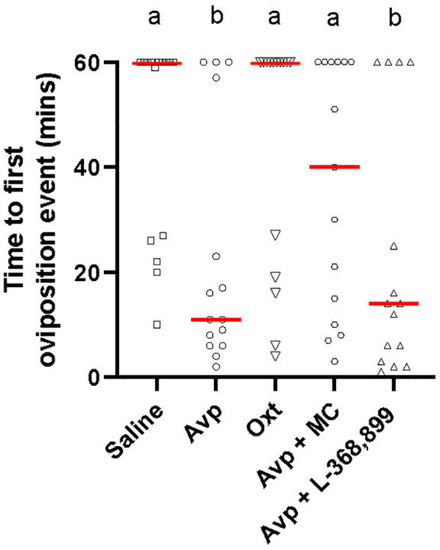
Time to first oviposition event during zebrafish pairwise mating trials with female cyp19a1b-/- mutant fish intraperitoneally injected with nonapeptides and mixed nonapeptides with receptor antagonists (n=15 per group). Significant differences were assessed using a Kruskal-Wallis test followed by a Dunn’s multiple comparisons test. Individual data points are displayed with red bars representing median values. Different letters a-b represent statistically significant differences. Statistical significance is defined at p<0.05. |
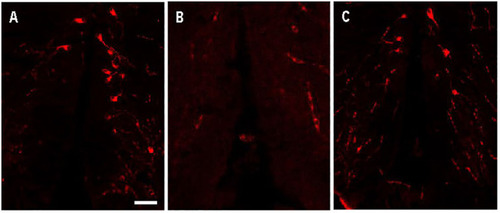
Arginine vasopressin (Avp) immunolabelling in pre-adsorption tests with Avp and Oxytocin (Oxt) in a transverse section of a female wildtype zebrafish preoptic area. The confocal images show Avp-immunopositive cell bodies surrounding the diencephalic ventricle |
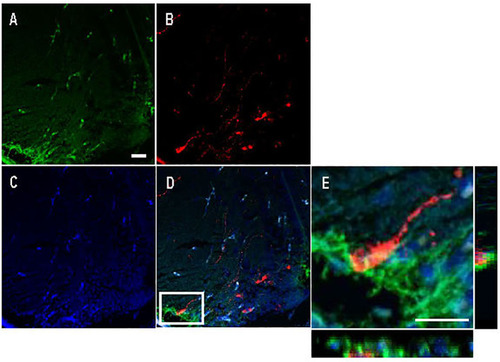
Double immunofluorescence against Cyp19a1b (green) and Arginine vasopressin (Avp; red) in a female Tg(cyp19a1b-GFP) zebrafish anterior preoptic area. In this transverse brain section, Cyp19a1b-positive radial glial cells fibres lining the peripheral layer of the ventral telencephalon |
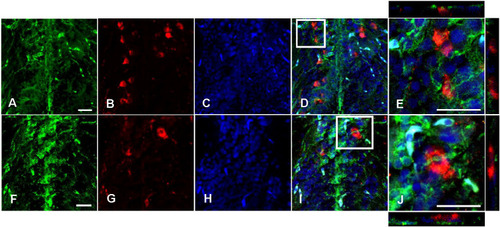
Double immunofluorescence against Cyp19a1b (green) and Arginine vasopressin (Avp; red) in a female Tg(cyp19a1b-GFP) zebrafish posterior preoptic area. In this transverse brain section, Cyp19a1b-positive radial glial cell fibres |