
- Title
-
Translational control of furina by an RNA regulon is important for left-right patterning, heart morphogenesis and cardiac valve function
- Authors
- Nagorska, A., Zaucker, A., Lambert, F., Inman, A., Toral-Perez, S., Gorodkin, J., Wan, Y., Smutny, M., Sampath, K.
- Source
- Full text @ Development
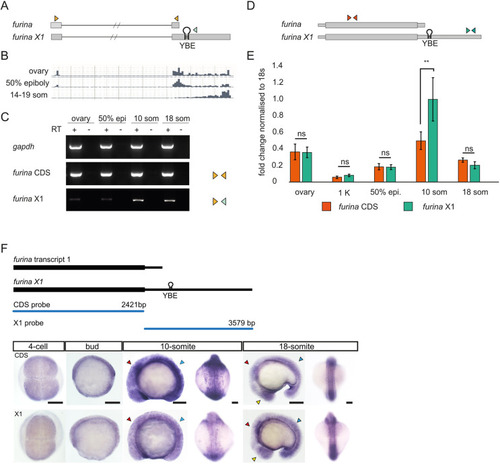
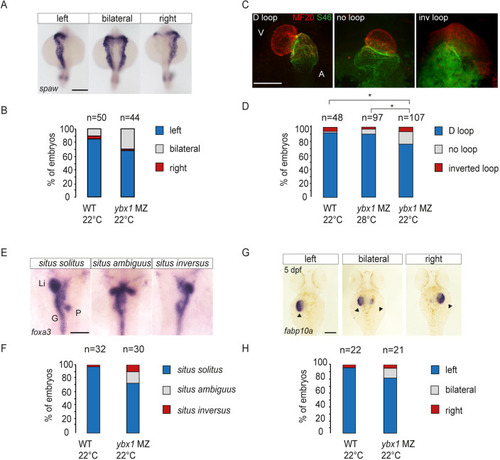
EXPRESSION / LABELING:
|
|
|
|
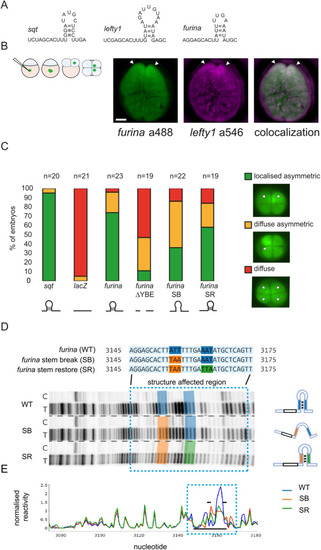
EXPRESSION / LABELING:
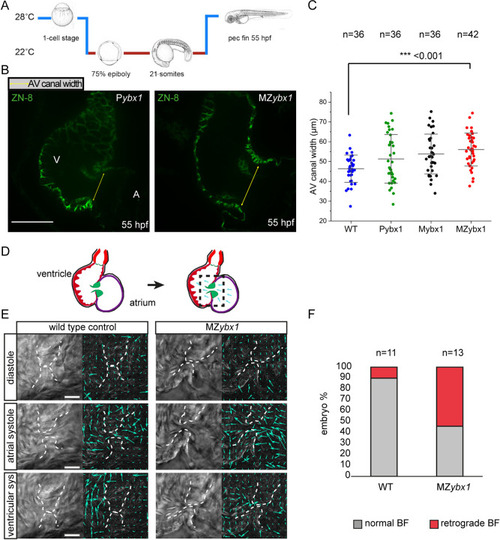
PHENOTYPE:
|
|
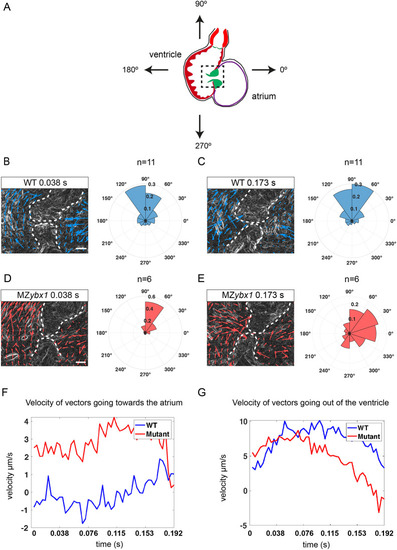
PHENOTYPE:
|
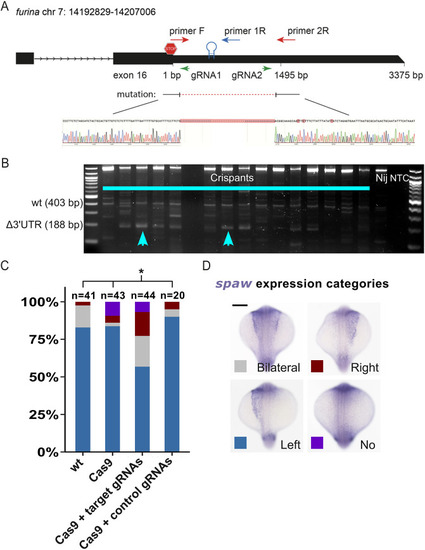
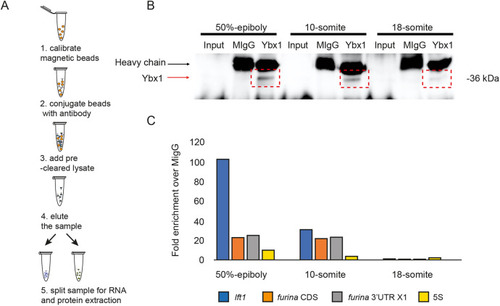
EXPRESSION / LABELING:
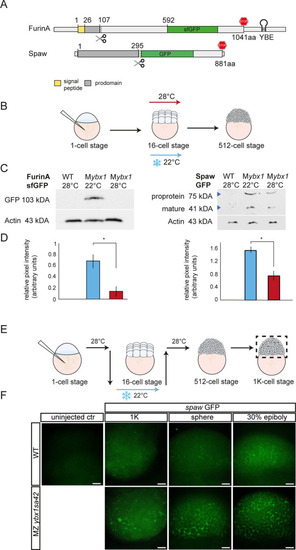
PHENOTYPE:
|