
- Title
-
A Role for Two-Pore Channel Type 2 (TPC2)-Mediated Regulation of Membrane Contact Sites During Zebrafish Notochord Biogenesis?
- Authors
- Rice, K.L., Chan, C.M., Kelu, J.J., Miller, A.L., Webb, S.E.
- Source
- Full text @ Contact (Thousand Oaks)
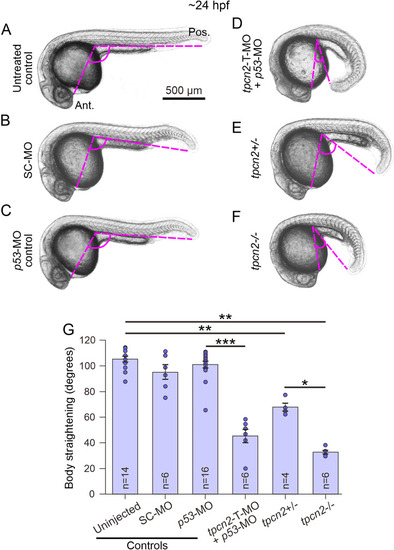
Effect of genetic attenuation of tpcn2 on body axis straightening in embryos at ∼24 hpf. Representative bright-field images showing the body axis straightening morphology in embryos at ∼24–25 hpf. Embryos were (A) untreated (control) or injected with (B) standard control (SC)-MO, (C) p53-MO, or (D) tpcn2-MO-T + p53-MO. In addition, representative bright-field images of a (E) tpcn2 heterozygous (tpcn2+/−) and (F) tpcn2 homozygous (tpcn2−/−) mutant are shown. The body axis straightening angle (indicated by the pink dashed lines) was measured. Ant and Pos are anterior and posterior, respectively. Scale bar, 500 µm. (G) Quantification of the body straightening angle. The bar chart shows the mean ± SEM body straightening angle on to which is superimposed the individual data points. The number (n) of embryos in each condition is shown. Statistical analysis was carried out using the Mann–Whitney U-test and data that were significantly different are represented by *p < .05, **p < .01, and ***p < .001. |
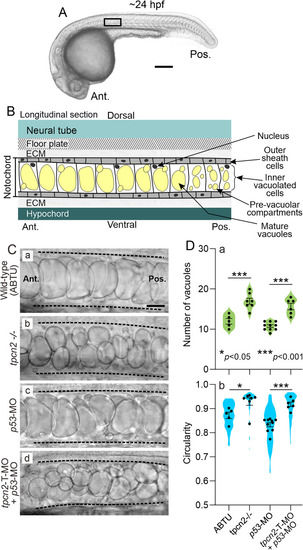
Effect of genetic attenuation of tpcn2 on the number and shape of notochord vacuoles in embryos at ∼24 hpf. (A) Bright-field image of an intact wild-type zebrafish embryo at ∼24 hpf and (B) schematic showing the basic structure of the notochord from a lateral view. In (A), the black rectangle indicates the location of the notochord (adjacent to somites 8–11), where higher magnification images were acquired. (Ca-d) Representative bright-field images showing lateral views of the notochord at higher magnification in a (Ca) wild-type (ABTU; n = 5) embryo, (Cb) tpcn2 homozygous mutant (tpcn2−/−; n = 7), (Cc) p53-MO-injected embryo (n = 6) and (Cd) tpcn2-T-MO + p53-MO-injected embryo (n = 6). In these images the black dashed lines indicate the dorsal and ventral boundaries of the notochord. Scale bars, 200 µm (A) and 20 µm (C). (D) Violin-plots (indicating the mean ± SEM) onto which are superimposed individual data points showing the (Da) number and (Db) circularity of vacuoles in the control, morphant, and mutant embryos shown in (C). An explanation of what these parameters refer to is provided in the Experimental Procedures. The data were compared using one-way ANOVA and Fisher's least significant difference (LSD). Significance is indicated as *p < .05, and ***p < .001. |