
- Title
-
Optogenetic Signaling Activation in Zebrafish Embryos
- Authors
- Saul, A.J., Rogers, C.E., Garmendia-Cedillos, M., Pohida, T., Rogers, K.W.
- Source
- Full text @ J. Vis. Exp.
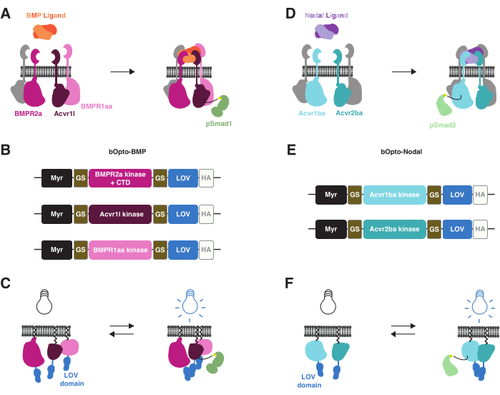
bOpto-BMP and -Nodal signaling activation strategy. (A) The endogenous BMP signaling pathway is activated by BMP ligand binding, leading to formation of a type I/II receptor complex, phosphorylation of Smad1/5/9, and expression of BMP target genes. The type I receptors BMPR1aa and Acvr1l are also known as Alk3 and Alk8, respectively. BMPR2a is a type II receptor. (B) bOpto-BMP constructs38. Putative kinase domains from BMPR1aa and Acvr1l are fused to LOV; the BMPR2a-LOV fusion contains the putative kinase domain and receptor C-terminal domain (CTD). All fusions are membrane-targeted with a myristoylation motif (Myr). Domains are separated by glycine-serine (GS) linkers. Constructs are tagged at the CTD with an HA epitope tag. This combination of three constructs was found to optimally activate BMP signaling. (C) bOpto-BMP-mediated BMP signaling activation. When exposed to blue light, LOV domains dimerize, which is thought to trigger complex formation and signaling activation. (D) The endogenous Nodal signaling pathway is activated by Nodal ligand binding, leading to formation of a type I/II receptor complex, phosphorylation of Smad2/3, and expression of Nodal target genes. The type I receptor Acvr1ba and the type II receptor Acvr2ba are also known as Acvr1b and Acvr2b, respectively. (E) bOpto-Nodal constructs39. Putative kinase domains from Acvr1ba and Acvr2ba are fused to LOV. All fusions are membrane-targeted with a myristoylation motif (Myr). Domains are separated by GS linkers. Constructs are tagged at the CTD with an HA epitope tag. (F) bOpto-Nodal-mediated Nodal signaling activation. When exposed to blue light, LOV domains dimerize, which is thought to trigger complex formation and signaling activation. |
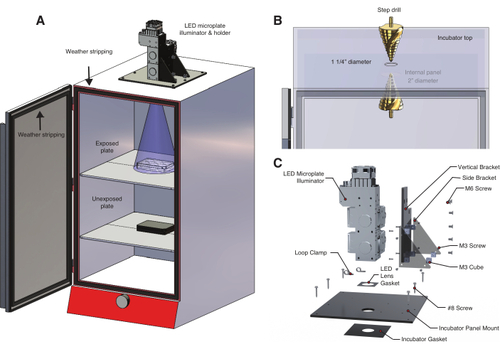
Temperature controlled light box for optogenetic experiments. (A) An LED microplate illuminator is mounted to the top of an incubator using a custom-built LED holder. Zebrafish embryos in a 6-well plate on the first shelf are exposed to light through a hole drilled into the top of the incubator. The lower shelf holds a second set of unexposed control embryos in an aluminum foil-wrapped 6-well plate. The incubator door is lined with weather stripping to prevent inadvertent exposure to room light or sunlight. (B) Detail of procedure to create a hole in the incubator using a step drill. The incubator model used here has an internal panel that required drilling a second, larger hole (Table of Materials). (C) Detail of the custom LED holder designed for a three-wavelength illumination system. |
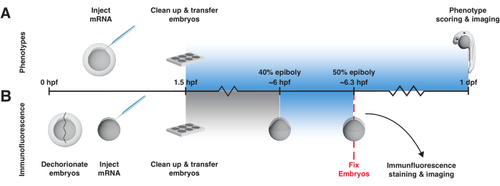
bOpto-BMP/Nodal experiment workflow. Phenotype assay and pSmad immunofluorescence staining to test activity of bOpto-BMP/Nodal. Embryos are injected with mRNA at the one-cell stage and transferred to a light box no later than 1.5 h post-fertilization (hpf). (A) Phenotype assay. Injected embryos and non-injected siblings are reared in the dark or exposed to uniform blue light starting at 1.5 hpf until 1-day post-fertilization (dpf). Optogenetic signaling activity can be evaluated by scoring embryos for phenotypes consistent with excess pathway activity. (B) pSmad immunofluorescence staining. Injected embryos and non-injected siblings are reared in the dark until 40% epiboly (~6 hpf). Half of the injected and half of the non-injected embryos are then exposed to uniform blue light for 20 min. After exposure, all embryos are fixed and subjected to immunofluorescence staining for pSmad. Elevated levels of pSmad1/5/9 or pSmad2/3 reflect optogenetic activation of BMP or Nodal signaling, respectively. |
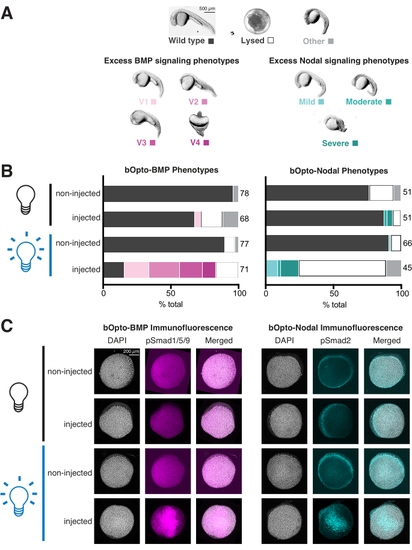
Assessing light-activated signaling responses in zebrafish embryos. Zebrafish embryos were injected at the one-cell stage with mRNA encoding bOpto-BMP/Nodal. (A) Embryos were either reared in the dark or exposed to uniform blue light starting at 1.5 h post fertilization (hpf). Phenotypes were scored at 1 day post fertilization (dpf). Representative phenotypes are shown. Excess BMP signaling leads to ventralization (left panel), while excess Nodal signaling causes developmental defects associated with extra mesendoderm (right panel). Scale bar = 500 µm. (B) Phenotype quantification. Injected embryos and non-injected siblings were reared in the dark starting at 1.5 hpf (black bulb). Half of the injected and half of the non-injected embryos were exposed to uniform blue light (blue bulb). (C) Injected embryos and non-injected siblings were reared in the dark starting at 1.5 hpf (black bulb). At 40% epiboly (~6 hpf), half of the injected and half of the non-injected embryos were exposed to uniform blue light (blue bulb). After 20 min, all embryos were fixed and subjected to immunofluorescence staining for either phosphorylated Smad1/5/9 or Smad2/3. Higher pSmad intensities indicate increased BMP/Nodal signaling, respectively. Scale bar = 200 µm. |