FIGURE SUMMARY
Title

Anti-diarrheal drug loperamide induces dysbiosis in zebrafish microbiota via bacterial inhibition

Authors
Stevick, R.J., Audrain, B., Bedu, S., Dray, N., Ghigo, J.M., Pérez-Pascual, D.
Source
Full text @ Microbiome

Experimental scheme of the larval zebrafish assays and sample collection. Conventional, mono-colonized, or mix5-colonized larval zebrafish were exposed at 5 dpf to water (control), DMSO (control) or 10 mg/L loperamide hydrochloride (treated) for 24 h and then transferred to water at 6 dpf. Samples were collected at 6 dpf, 7 dpf, and 11 dpf (T0, T1, T5) to measure fish growth and quantify bacterial community composition in all conditions (dpf, days post fertilization; CFUs, colony-forming units)

Loperamide affects conventional zebrafish microbiota as measured by 16S rRNA gene amplicons. A NMDS plot calculated using Bray–Curtis beta-diversity (k = 2) of percent normalized ASVs from 16S rRNA gene amplicons. Ellipse lines show the 95% confidence interval (standard deviation). Stress = 0.136; adonis2 PERMANOVA R2 = 0.104; p = 0.029*. Only DMSO and loperamide-treated samples are shown. B Significant differentially abundant genera in loperamide-treated fish, compared to DMSO controls at each timepoint calculated using Limma (one against one) with conditions: relative log expression (RLE) normalized, effect log fold change > 2, Benjamini and Hochberg adjusted p-value < 0.05 (n = 5 per condition). Genera that occur at mean percent abundance > 1% are outlined in black and bold. C Beta-dispersion or within-condition dissimilarity index calculated using Bray–Curtis beta-diversity (n = 20). ****p < 0.001 for loperamide treatment, compared to DMSO. Wilcoxon test

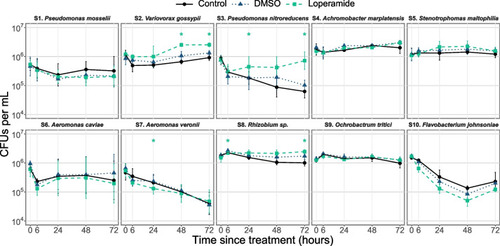
In vitro survival in water of zebrafish-associated bacterial strains is affected by loperamide. Survival in water for 72 h after inoculation at 106 CFUs/mL (mean ± standard deviation per condition is shown, n = 6–12: 2–4 independent assays of 3 biological replicates). *p < 0.05 for loperamide treatment, compared to DMSO. Wilcoxon test. Note log scale on y-axis

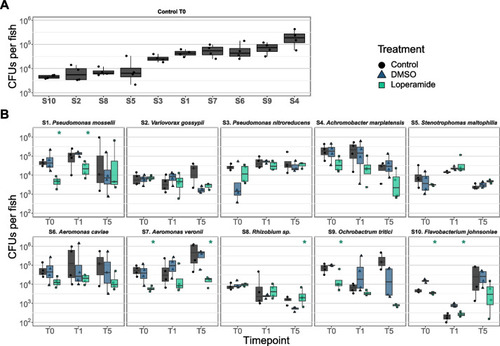
Loperamide can increase or reduce zebrafish mono-colonization. CFUs per fish of mono-colonized fish in A control conditions at T0 (6 dpf) ordered by colonization capacity and B after exposure to loperamide at 3 timepoints (n = 4 fish). Each point represents a single zebrafish (mean of 3 technical replicates). *p < 0.05 for loperamide treatment, compared to DMSO. Wilcoxon test. Note log scale for y-axis

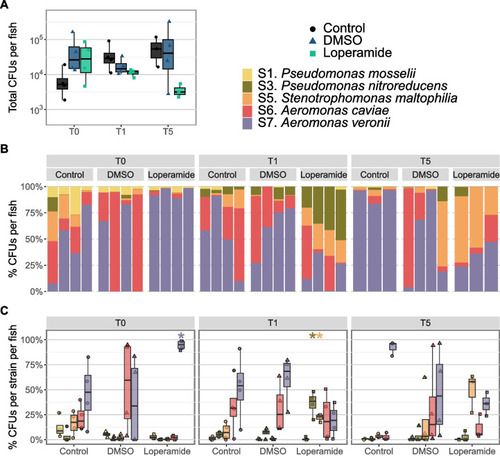
Loperamide affects mix5-colonized gnotobiotic zebrafish bacterial load and composition. A Total CFUs per fish of mix5-colonized fish after exposure to loperamide at 3 timepoints (n = 3–4 fish). Each point represents a single zebrafish (mean of 3 technical replicates). No significant changes were found for loperamide treatment, compared to DMSO. Wilcoxon test. Note log scale for CFUs. B Percent abundance of each strain per mix5-colonized fish. Each bar is an individual fish sample. C Percent abundance of each strain in mix5-colonized fish per timepoint and treatment. Each point represents a single zebrafish (mean of 3 technical replicates). *p < 0.05 for loperamide treatment, compared to DMSO. Wilcoxon test

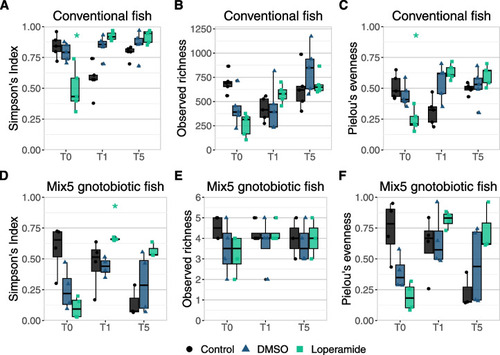
Simpson’s diversity of conventional and gnotobiotic zebrafish decreases but recovers after loperamide treatment. Alpha-diversity indices calculated at each timepoint for control water, DMSO, and loperamide-treated samples for AC 16S rRNA gene amplicon data at the ASV level in conventional fish (n = 5 fish) and DF CFUs per strain in mix5-colonized fish (n = 3–4 fish). A and D Simpson’s index (H). B and E Observed richness (Sobs) and C and F Pielou’s evenness (H/log(Sobs) are shown. Each point represents a single zebrafish with boxplots shown per condition. *p < 0.05 for loperamide treatment, compared to DMSO. Wilcoxon test

Acknowledgments
This image is the copyrighted work of the attributed author or publisher, and ZFIN has permission only to display this image to its users. Additional permissions should be obtained from the applicable author or publisher of the image. Full text @ Microbiome