Single cell labelling and imaging of delaminating otic NBs. (A) Schematics of otic NB delamination in the neurogenic domain (red) at 20 hpf and SAG shape (green) at 54 hpf. (B) Labelling of the otic epithelial membranes at 24 hpf (left) and the SAG at 54 hpf (right), the latter being located behind the otic vesicle (white dashed oval). Both images are lateral views. An NB (pseudocoloured green) delaminating from the neurogenic domain displays a distinct shape compared with non-delaminating otic cells (pseudocoloured purple). The boxed area represents the region from where images in C and D are taken. Different SAG lobes are outlined with a green line. (C) Single-labelled delaminating NB undergoing apical thinning (white arrowhead). The NB exits neuroepithelia leaving membrane traces inside neuroepithelia (white arrows). The images shown in C are from Movie 1, and are also depicted in Fig. S1C (top) with Pard3-GFP fluorescence. (D) NB from the neurogenic domain extending dynamic filopodia and blebs (white arrowheads) (representative of n=7). See also Movie 2. (E) Delaminating NB undergoing apical thinning and Pard3 relocation. Pard3 moves from apical to basal domains concomitantly with membrane zippering (white arrowheads) and accumulation of Pard3 in basal domains (yellow arrowhead). Right-hand panel represents a scheme of this phenomenon. (F) Collective delamination of NBs. NBs extend filopodia in the collective front while delaminating (white arrowheads) and Pard3 relocates (white arrows) without losing its punctate pattern (representative of n=7). (G) After delamination, a group of contacting NBs separate (blue and orange dots) concomitantly with Pard3 rearrangements (representative of n=3). (H) Arl13 staining in magenta. Non-neurogenic (upper dashed square) and neurogenic (lower dashed square) anterior domains are indicated, representing the region of insets in H′ and H″, respectively, from a different embryo. The Arl13b reporter is observed inside the neuroepithelia in the neurogenic domain, but is absent in the non-neurogenic domain. A spatial section across time (white transverse line corresponding to kymographs) shows the presence of Arl13 reporter in the neurogenic region only (representative of n=10). a, apical; aLL, anterior Lateral Line ganglion; b, basal. Anterior is to the left, posterior to the right in all images. Scale bars: 20 µm (B,H); 10 µm (C-G,H′,H″).
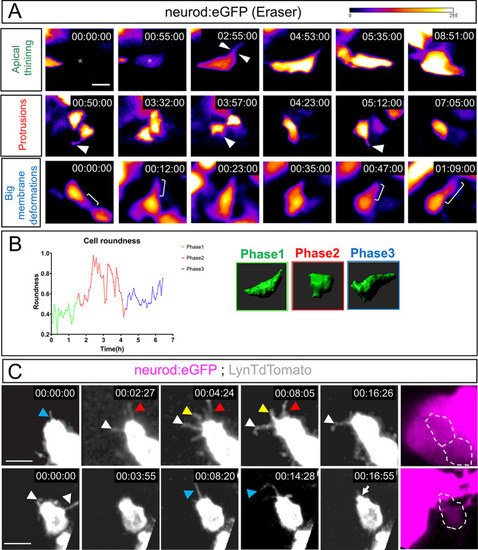
Delaminated otic NBs dynamically change their shape, producing filopodia and membrane protrusions. (A) Single-cell labelling of delaminating NBs with CRISPR Eraser in Tg(neurod:eGFP). Delaminating NBs undergo apical thinning and delamination (white arrowheads in top row) right after starting to express neurod (asterisks). Subsequently, they acquire a much more rounded, mesenchymal shape and produce membrane protrusions (white arrowheads, middle row). Finally, membrane protrusions precede large membrane deformations (white brackets, bottom row). Representative of n=7. (B) Example of the change in roundness of one NB through the different phases. Phases are colour-coded and a 3D IMARIS reconstruction is shown on the right. (C) NBs produce dynamic filopodia after delamination (coloured arrowheads). Bottom row shows how a membrane protrusion becomes a much bigger membrane deformation (white arrow). Panels on the right show cells in left-hand panels depicted inside the dashed lines with eGFP staining from Neurod+ cells shown in magenta. Scale bars: 10 µm.
Otic NBs engage in RhoGTPase-dependent active and directed migration. (A,A′) Three NBs migrating from lateral, medial and posteroventral regions in control wild-type conditions under CRISPR Eraser in Tg(neurod:eGFP) (A) or in fish overexpressing DNRac1a (A′) (magenta pseudocoloured cells, tracks in white). See also Movie 7. (B) Migratory pattern under DNCdc42 and DNRho conditions. DNCdc42 and DNRho recapitulate the effect of reduced directed migration. (C) In contrast, CACdc42 and CARho show similar or even enhanced migration compared with control cells (asterisks). (D) Summary of tracked control and DNRac1a-expressing cells using DiPER. Tracks are normalized at the origin according to published protocols (Breau et al., 2017; Gorelik and Gautreau, 2014). Control cells migrate further and more directionally than DNRac1a cells. (E) Dispersion of cells (95% confidence interval) at the endpoint of the time lapse after normalization of tracks to the origin, in control (blue) and DNRac1a (orange) conditions. (F) Effective distance migrated is significantly compromised in DNRac1a compared with controls. This is measured as the length of a straight line between the start and end point of a given cell irrespective of their particular migratory path in the recordings. The distance covered in the x-axis is also compromised. Ticks in the x-axis represent increase every 10 µm. **P<0.005 (Mann-Whitney U-test for non-parametric data). (G) Instant velocities (space covered/time between frames) of delaminated NBs across time. The migratory capacity of cells is affected little because the mean (blue and orange dashed lines) of both control NB and DNRac1a NB is the same, although dispersion of standard deviation increases towards the end of the recording in the DNRac1a condition (orange area) versus controls (blue area). Black vertical dashed line indicates half of the recording time. For detailed tracked velocities, see Fig. S6. For DNRac1a analysis, the phenomenon was observed in n=25 control cells and n=30 DNRac1 cells, from 7 and 14 embryos, respectively. Scale bars: 20 µm. See Fig. S6 for individual cell migratory profiles. Regarding Cdc42 and Rho1 experiments, control cells of the DN condition migrate normally in 2/2 cases; DNCdc42 cells migrate normally in 4/7; DNRho cells migrate normally in 1/4 cases. Control cells of the CA condition migrate normally in 5/5 cases; CACdc42 cells migrate normally in 3/6; CARho cells migrate normally in 1/4 cases. Controls were injected with UAS:mCherry plasmid. All embryos were siblings from the same batch of injection. In images, the otic vesicle is outlined with a faint grey dashed ellipse. Tracked cells are pseudocoloured in magenta and tracks in white. Scale bars: 20 µm. See also Movie 8. ns, not significant.
Delaminating NBs directionally migrate towards a common coalescence region. (A) Two tracks (white lines) of delaminated NBs from lateral domains of the otic neurogenic region. (B) Two tracks (white lines) of delaminated NBs from medioventral domains of the otic neurogenic region. The otic vesicle contour is delineated with a white dashed line. See also Fig. S8 and associated Movies 9 and 10. (C) Summary tracks using DiPER normalized to the origin and directionality rose plots (cyan for lateral and green for medioventral) of delaminating NBs (Breau et al., 2017; Gorelik and Gautreau, 2014) showing that migration of NBs is directed. Ticks in axes represent 10 µm increases. (D) Graphs of quantified data of NB migratory properties. Black arrowheads depict maximum velocities. Individual data shown in dark orange dots. Horizontal line is the median. Light orange shadows represent the s.d. For a separate analysis of lateral and medial delaminating cells, see Fig. S8. (E) Top panels show an otic delaminating NB (outlined in white) migrating towards the aLL. Lower panels show an NB (outlined in white) migrating towards the SAG. (F) Tracking several NBs in the same embryo shows aggregation towards a common region (asterisk) irrespective of NB origin inside the otic neuroepithelia. White arrowhead indicates an otic NB attracted to the aLL. (G) Graphic summary of migratory paths undertaken by NBs. Lateral NB shown in blue, medial NB shown in green. Dotted lines represent the migratory paths. Black dotted line shows aLL NB migrating to the SAG. (H) Qualitative examples of non-collective and collective migration. Otic epithelium encircled with dashed line. Migrating NBs outlined with white line. (I) Plotting several cases summing the distance of one NB with respect to its neighbours across times shows a negative overall regression, which is indicative of distance shortening between cells, thus indicating aggregation. Otic vesicles are depicted inside white dashed lines. Images in A and H are from the same raw data as Movies 9 and 11, but with different contrast enhancements to the images to show tracking of individual or contiguous cells. Anterior is always to the left and posterior to the right. aLL, anterior Lateral Line. Scale bars: 20 µm.
Pioneer SAG neurons of extra-otic origin initially populate the coalescence region. (A) Extra-otic pioneer SAG neurons are specified anterior to the otic placode (white dashed oval) and posterior to the trigeminal ganglion (magenta signal in left corner) at around 13 hpf. Pioneer SAG neurons migrate and initially populate the coalescence region in anterior locations of the otic placode. Migrating cells outlined in top and lower panels. Medial panels show different cell trajectories towards the otic vesicle (dashed line). (B) Pioneer SAG neurons are Neurod+ cells that do not ingress into the otic epithelium. Ingression takes place at 13.5 hpf (arrow) but not later (inhibitory symbol). Otic vesicle outlined with dashed line. Right panel shows ingressing cells in magenta and non-ingressing cells in green. (B′) Quantification of the number of cells ingressing or not depending on gene expression. Scale bars: 20 µm (A); 10 µm (B).
Pioneer SAG neurons have a role in organizing the SAG. (A) Scheme of experimental design. At 16 hpf, pioneer SAG neurons are photoconverted and subsequently photoablated. The absence of magenta photoconverted cells at later stages indicates complete cell ablation. SAG development was imaged from 20-24 hpf to 34 hpf. OP, otic placode. (B) After partial (asterisk) or total ablation of Neurod+ cells anterior to the otic placode at 16 hpf, an altered shape of the SAG and an apparently reduced number of NBs can already be observed at 24 hpf. At 34 hpf, the formation of the posterior lobe is abrogated in the ablated conditions (blue dotted line; see also Fig. S10). The experiment was replicated three times. n control=4+3+6; n ablated condition=4+3+11 (n=number of embryos). (C) Migratory properties of otic NBs in control (green) or after ablation of pioneer SAG neurons (magenta) measured with DiPER (Breau et al., 2017; Gorelik and Gautreau, 2014). (C′) NB migration directionality and pathway are compromised in after pioneer SAG neuron ablation compared with controls. n=23 control cells, n=36 ablated condition cells, from 4 and 10 embryos, respectively for each condition. Each tick in axes represents a 15 µm increase. (C″) NB dispersion (95% confidence interval) according to the last timepoint position with tracks normalized to the origin in control (green dots) versus ablated (magenta dots) conditions. Non-overlapping regions illustrate the variance in dispersion, which is significant in the y-axis but non-significant in the x-axis (ns). Ticks in axes represent 10 µm. (C‴) NBs are able to migrate faster in the ablation condition. The mean migratory profile is not majorly affected, except that dispersion of velocity is increased in the ablated condition at initial stages of migration (Fig. S11 shows detailed individual migratory profiles). The number of cells populating the SAG is significantly reduced in the ablation condition, more than the number of cells ablated (Fig. S9A) and consequently SAG volume (Fig. S10). N number of embryos for this section (C‴) is 4 both for control and the ablated condition. *P<0.05, ***P<0.0005 (two-tailed Student's t-test). (D) Two examples of migration of NBs (photoconverted magenta cell, yellow tracks) between lateral and medial regions of the neurogenic domain. The otic vesicle is depicted within a white dashed line. Total control embryos n=6; total ablated embryos n=11 for this section (D). Scale bars: 20 µm.
Pioneer SAG neurons are required for SAG development. (A) Summary of the cellular behaviours of otic NBs addressed in this study. (B) Lack of pioneer SAG neurons (red) disrupts SAG shape (light green) and NB migration (dark green cells and arrows). Anterior Lateral Line (aLL) NB depicted in grey.
Acknowledgments
This image is the copyrighted work of the attributed author or publisher, and
ZFIN has permission only to display this image to its users.
Additional permissions should be obtained from the applicable author or publisher of the image.
Full text @ Development
Your Input Welcome
Thank you for submitting comments. Your input has been emailed to ZFIN curators who may contact you if
additional information is required.
Oops. Something went wrong. Please try again later.