FIGURE SUMMARY
Title

Small leucine-rich proteoglycans inhibit CNS regeneration by modifying the structural and mechanical properties of the lesion environment

Authors
Kolb, J., Tsata, V., John, N., Kim, K., Möckel, C., Rosso, G., Kurbel, V., Parmar, A., Sharma, G., Karandasheva, K., Abuhattum, S., Lyraki, O., Beck, T., Müller, P., Schlüßler, R., Frischknecht, R., Wehner, A., Krombholz, N., Steigenberger, B., Beis, D., Takeoka, A., Blümcke, I., Möllmert, S., Singh, K., Guck, J., Kobow, K., Wehner, D.
Source
Full text @ Nat. Commun.

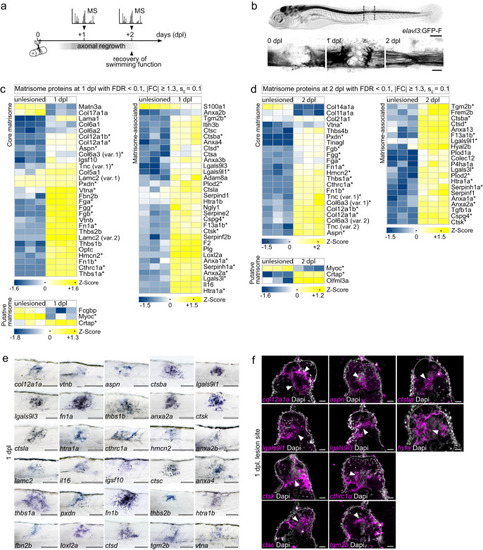
Mass spectrometry-based quantitative proteomics reveals changes in ECM composition during zebrafish spinal cord regeneration.

a Timeline of axonal regrowth and functional recovery after SCI in larval zebrafish. Timepoints of tissue collection for mass spectrometry (MS) analysis are indicated. b Time course of axonal regrowth after spinal cord transection. Shown is the same animal at different timepoints after SCI. Dashed lines indicate the dissected trunk region for MS analysis. Images shown are maximum intensity projections of the spinal lesion site (lateral view; rostral is left). cd Heatmaps of matrisome proteins exhibiting differential abundance between lesioned (1 dpl, c; 2 dpl, d) and unlesioned age-matched groups (n = 3 independent biological replicates for each experimental group). Each column represents one biological replicate and each row one protein. Permutation-based FDR calculation, two-tailed Student’s t-test. Asterisks indicate matrisome proteins that are common to both timepoints. e Expression of the indicated genes, coding for differentially regulated matrisome proteins, is upregulated in the lesion site, as determined by in situ hybridization (ISH; lateral view; rostral is left). n ≥ 9 animals for each gene. f Expression of indicated genes, coding for differentially regulated matrisome proteins, is detected in the spinal cord stump, its immediate vicinity, or the highly disorganized lesion core (arrowhead), as determined by fluorescence ISH on transversal tissue sections (dorsal is up). Asterisks indicate staining artifacts. n ≥ 5 animals for each gene. af Scale bars: 250 µm (b, top), 100 µm (e), 25 µm (b, bottom), 20 µm (f). dpl days post-lesion, FC fold change, FDR false discovery rate, var variant.

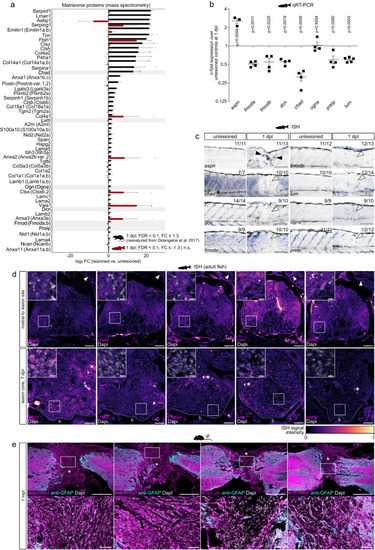
SLRPs are differentially enriched in CNS lesions of rodents and zebrafish.

a Matrisome proteins that exhibit a high abundance after SCI in rat (black) but a low abundance in the zebrafish (red) spinal lesion site are shown. The SLRPs Chad, Lum, Ogn (Ogna), Dcn, Fmod (Fmoda, Fmodb), and Prelp are highlighted. Data are means ± SEM. b Fold change expression of indicated genes in the zebrafish spinal lesion site over unlesioned controls, as determined by qRT-PCR. Expression of aspn but not fmoda, fmodb, dcn, chad, ogna, prelp, and lum is upregulated. Fold change values are presented in log scale. Each data point represents one independent experiment. Data are means ± SEM. Paired two-tailed Student’s t-test. c Expression of aspn (black arrowheads) but not chad, dcn, fmoda, fmodb, lum, ogna, and prelp (white arrowheads) is upregulated in the zebrafish spinal lesion site, as determined by in situ hybridization (ISH). The number of animals displaying the phenotype and the total number of animals is given. Images show lesion site or unlesioned trunk (lateral view; rostral is left). d Expression of aspn but not chad, fmoda, lum, and prelp is increased in the spinal lesion core of adult zebrafish, as compared to baseline levels in rostral control segments of the same animal. Arrowheads indicate fluorescence ISH signal in myotendinous junctions. Asterisks indicate signal in blood vessels. Shown are transversal sections (dorsal is up). Dapi channel is only shown in insets. Dashed lines indicate vertebra. The same results were obtained in three indepedent experiments over n = 6 animals. e Chad, Fmod, Lum, and Prelp proteins are abundant in the fibrous scar after spinal cord transection in adult mice, as detected by immunofluorescence (IF). Images shown are sagittal sections. Asterisks indicate lesion core. Dapi channel is only shown in insets. n = 3 animals for each protein. ae Scale bars: 500 µm (e), 100 µm (c), 50 µm (d, insets in e), 10 µm (insets in d). b bone, dpl days post-lesion, FC fold change, FDR false discovery rate, mpl months post-lesion, n.s not significant. The rat and mouse icons in a and e were created using BioRender. Source data are provided as a Source Data file.

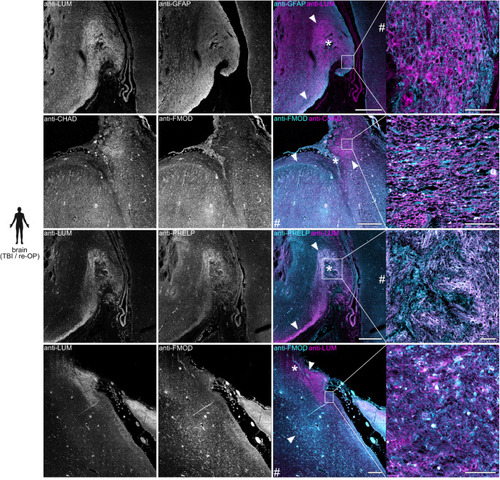
SLRPs are enriched in human brain lesions.

Anti-CHAD, anti-FMOD, anti-LUM, and anti-PRELP immunoreactivity is locally increased in areas of scarring caused by contusion, local hemorrhage, or previous surgery (asterisks indicate lesion center, arrowheads mark scar boundaries) in the human brain, as compared to regions distant to the primary lesion site (hash sign), as well as human brain controls with no signs of fibrotic scarring (see Supplementary Fig. 3). Shown are coronal sections of brain tissue from patients with traumatic brain injury (TBI) or previous surgery (re-OP; bottom panel). Six (n = 6) cases with scars following TBI or previous surgery were analyzed and showed similar results (Supplementary Table 1). Scale bars: 500 µm, 50 µm (insets). The human icon in the panel was created using BioRender.

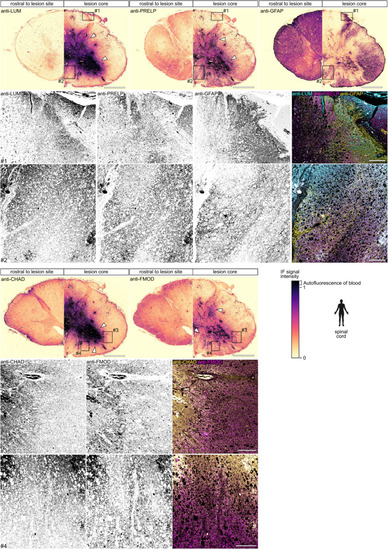
SLRPs are enriched in human spinal cord lesions.

Anti-LUM, anti-PRELP, anti-CHAD, and anti-FMOD immunoreactivity is increased (arrowheads; see calibration bar of lookup table (LUT)) in the epicenter of the injured human spinal cord at nine days-post injury, as compared to rostral control segments of the same patient. Note that immunoreactivity is mainly observed in proximity to the hemorrhage (black; see calibration bar of LUT). Also note that with the exception of blood-derived autofluorescence, individual channels show distinct pattern of immunofluorescence (IF) signal (insets). Shown are transversal sections (dorsal is up). Similar results were obtained for anti-LUM in five out of six cases, for anti-PRELP and anti-FMOD in four out of six cases, and anti-CHAD in two out of six cases (Supplementary Table 3). Scale bars: 2 mm, 200 µm (insets). The human icon in the panel was created using BioRender.

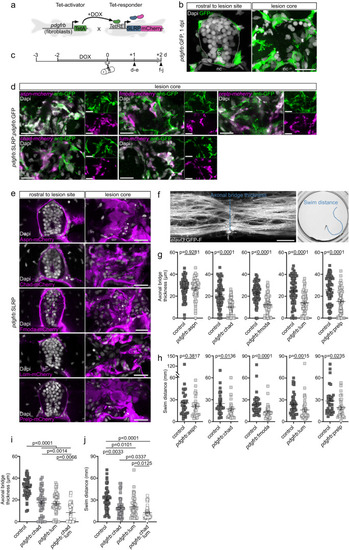
SLRPs are inhibitory to CNS axon regeneration.

a Strategy to achieve pdgfrb+ fibroblast-specific expression of slrp-mCherry fusions using the TetON system. bpdgfrb+ fibroblasts (green) accumulate in the lesion core (n ≥ 10 animals)13. Dashed line indicates boundaries of the intact spinal cord. c Schematic timeline of the experimental design using the TetON system. d In the lesion core, mRNA expression of indicated slrp-mCherry fusions (magenta) is selectively induced in pdgfrb+ fibroblasts (green) in pdgfrb:TetA;TetRE:SLRP-mCherry (pdgfrb:SLRP);pdgfrb:GFP transgenic zebrafish. Similar results were obtained in n ≥ 10 animals for each experimental condition. epdgfrb+ fibroblast-specific induction of indicated slrp-mCherry fusions leads to increased mCherry fluorescence (magenta) in the lesion core. Similar results were obtained in n ≥ 10 animals for each experimental condition. fhpdgfrb+ fibroblast-specific induction of chad, fmoda, lum, and prelp but not aspn reduces the thickness of the axonal bridge (f, g) and impairs recovery of swim distance (f, h). Two-tailed Mann-Whitney test (g: Aspn, Chad; h), Two-tailed Student’s t-test (g: Fmoda, Lum, Prelp). ncontrol = 59, nAspn = 61; ncontrol = 59, nChad = 60; ncontrol = 63, nFmoda = 64; ncontrol = 60, nLum = 60; ncontrol = 60, nPrelp = 60 animals over four independent experiments (g). ncontrol = 30, nAspn = 30; ncontrol = 30, nChad = 39; ncontrol = 34, nFmoda = 32; ncontrol = 43, nLum = 43; ncontrol = 31, nPrelp = 31 animals (h). Image of the axonal bridge shown in f is a maximum intensity projection of the center of the spinal lesion site (lateral view; rostral is left). Note that neuronal somata are largely absent from the lesion core due to the acute mechanical trauma of the spinal cord transection. ij Combinatorial induction of chad and lum in pdgfrb+ fibroblasts enhances the inhibitory effect of individual SLRPs on axon regeneration (i) and recovery of swim distance (j). Kruskal-Wallis test followed by Dunn’ multiple comparison. ncontrol = 45, nChad = 48; nLum = 48; nChad+Lum = 48 animals over three independent experiments (i). ncontrol = 45, nChad = 45; nLum = 45; nChad+Lum = 45 (j). aj Each data point represents one animal. Data are means ± SEM. Images shown in b, d, and e are transversal views of the unlesioned trunk or lesion core (dorsal is up). Scale bars: 20 µm. d days, dpl days post-lesion, DOX doxycycline, fp floor plate, nc notochord. Source data are provided as a Source Data file.

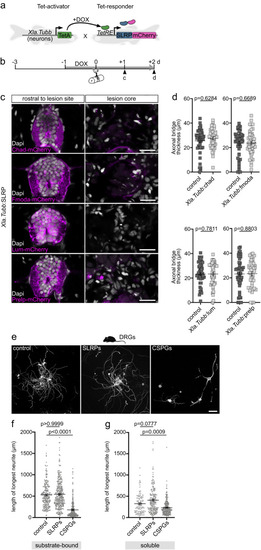
SLRPs do not directly act on neurons to inhibit axon regeneration.

a Strategy to achieve neuron-specific expression of slrp-mCherry fusions using the TetON system. b Schematic timeline of the experimental design using the TetON system. c Neuron-specific induction of indicated slrp-mCherry fusions in Xla.Tubb:TetA;TetRE:SLRP-mCherry (short Xla.Tubb:SLRP) transgenic zebrafish leads to negligible mCherry fluorescence (magenta) in the lesion core. Note that the lesion core lacks neuronal somata. Also note that strong mCherry fluorescence (magenta) is detectable in intact spinal cord tissue rostral to the lesion core. The same results were obtained in n ≥ 10 animals for each experimental condition. Images shown are transversal views of the unlesioned trunk or lesion site (dorsal is up). d Neuron-specific induction of chad, fmoda, lum, or prelp in Xla.Tubb:SLRP transgenic zebrafish does not reduce the thickness of the axonal bridge. Each data point represents one animal. Two-tailed Mann-Whitney test. ncontrol = 45, nChad = 45; ncontrol = 45, nFmoda = 45; ncontrol = 47, nLum = 45; ncontrol = 46, nPrelp = 44 animals over three independent experiments. eg Neurite outgrowth of primary adult murine dorsal root ganglion (DRG) neurons is not reduced in the presence of human SLRP proteins (mixture of CHAD, FMOD, LUM, PRELP), as compared to controls. Neurite growth is significantly reduced in the presence of CSPGs. f DRGs were cultured on glass coverslips with substrate-bound laminin, laminin and SLRPs, or laminin and CSPGs. g DRGs were cultured on laminin-coated glass coverslips and growth medium was supplemented with either SLRPs, CSPGs, or solvent control. Each data point represents one DRG neuron. Kruskal-Wallis test followed by Dunn’ multiple comparison. ncontrol = 229, nSLRPs = 321, nCSPGs = 315 (f); ncontrol = 100, nSLRPs = 194, nCSPGs = 266 (g). The experiment was repeated once. ag Data are means ± SEM. Scale bars: 100 µm (e), 20 µm (c). d days, dpl days post-lesion, DOX doxycycline. The mouse icon in the panel was created using BioRender. Source data are provided as a Source Data file.

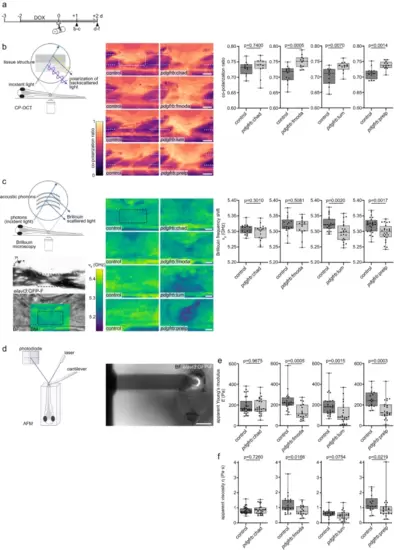
SLRPs modulate the structural and mechanical properties of the lesion environment a Timeline for experimental treatments shown in b–f. b Targeting Fmoda, Lum, or Prelp to the injury ECM in pdgfrb:SLRP transgenic zebrafish increases the co-polarization ratio in the spinal lesion site, as determined by cross-polarized optical coherence tomography (CP-OCT). Images shown are average intensity projections of the lesion site (lateral view; rostral is left). The dashed lines indicate the location of the severed spinal cord, the dashed rectangle indicates the region of quantification. Two-tailed Student’s t-test. ncontrol = 11, nChad = 11; ncontro = 12, nFmoda = 12; ncontro = 10, nLum = 12; ncontrol = 12, nPrelp = 12 animals. c Targeting Lum or Prelp to the injury ECM in pdgfrb:SLRP transgenic zebrafish decreases the Brillouin frequency shift ( ) in the spinal lesion site, as determined by Brillouin microscopy. Images shown are sagittal optical sections (brightfield intensity, confocal fluorescence, or Brillouin frequency shift map) through the center of the lesion site of an elavl3:GFP-F transgenic zebrafish (lateral view; rostral is left). The dashed rectangle indicates the region of quantification. Two-tailed Student’s t-test. ncontrol = 17, nChad = 17; ncontrol = 17, nFmoda = 16; ncontrol = 23, nLum = 22; ncontrol = 24, nPrelp = 24 animals over three (Chad, Fmoda) or four (Lum, Prelp) independent experiments. d–f Targeting Fmoda, Lum, or Prelp to the injury ECM in pdgfrb:SLRP transgenic zebrafish decreases the apparent Young’s modulus (E) (e; Fmoda, Lum, Prelp) and apparent viscosity (η) (f; Fmoda, Prelp) in the spinal lesion site, as determined by atomic force microscopy-based nanoindentation measurements (AFM). Recorded force-indentation curves were fitted to the Kelvin─Voigt─Maxwell model. Two-tailed Mann-Whitney test. ncontrol = 30, nChad = 26; ncontrol = 22, nFmoda = 17; ncontrol = 24, nLum = 23; ncontrol = 17, nPrelp = 23 animals over three (Chad, Fmoda, Prelp) or four (Lum) independent experiments. a–f Each data point represents one animal. Box plots show the median, first, and third quartile. Whiskers indicate the minimum and maximum values. Scale bars: 500 µm (d), 50 µm (b), 10 µm (c). BF brightfield intensity, BM Brillouin frequency shift map, d days, dpl days post-lesion, DOX doxycycline. Source data are provided as a Source Data file.

Acknowledgments
This image is the copyrighted work of the attributed author or publisher, and ZFIN has permission only to display this image to its users. Additional permissions should be obtained from the applicable author or publisher of the image. Full text @ Nat. Commun.