FIGURE SUMMARY
Title

Novel bi-allelic variants of CHMP1A contribute to pontocerebellar hypoplasia type 8: additional clinical and genetic evidence

Authors
He, T., Sun, H., Xu, B., Qu, H., Cai, X., Zhou, H., Liu, Y., Lin, Z., Zhang, X.
Source
Full text @ Front Neurol

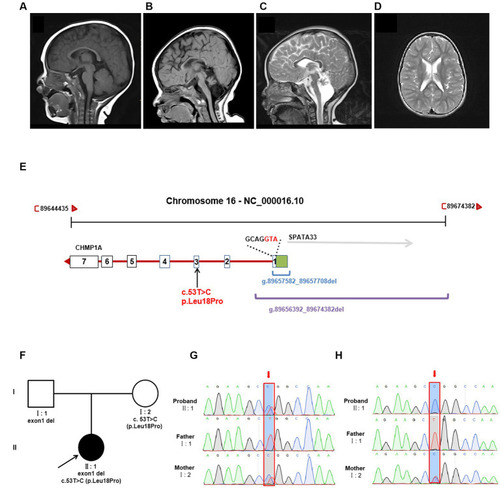
Brain MRI and genetic analysis for two novel
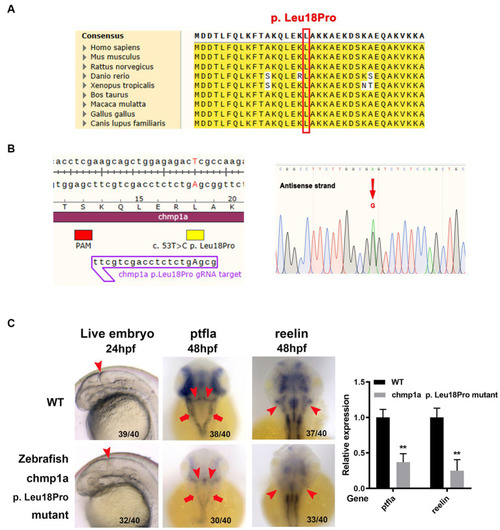
 CHMP1A variants. (A–C) T1-weighted sagittal brain MRI images of a normal seven-month-old individual (A), and this patient at seven months (B), and T2-weighted sagittal brain MRI images of this patient at six years of age (C,D). Compared to a control, this patient shows severe hypoplasia of the cerebellum (vermis and hemispheres), small pons, a thin corpus callosum, and mild reduction cortical volume. Hyperintensity in bilateral paraventricular white matter was found, which suggested myelin dysplasia. (E) Schematic diagram of two novel CHMP1A variants. The purple line represents the entire deletion region (NC_000016.10: g.89656392_89674382del) identified by Whole genome sequencing, which includes the entire exon one of CHMP1A (green box represents the untranslated region, the white box represents the coding region, containing seven bases with ATG as the start codon) and a portion of downstream introns, as well as the upstream SPAT33 gene. The blue line represents the exon one deletion (NC_000016.10:g.89657582_89657708del) identified by whole exome sequencing. The CHMP1A gene has seven exons, and another allelic variant c.53 T > C is located in exon three. (F) Family pedigree. The proband has two novel variants in CHMP1A, one is a missense variant, c.53 T > C(p. Leu18Pro) from the mother, and the other is a deletion of exon one region (NC_000016.10:g.89657582_89657708del) from the father. (G,H) Sanger sequencing analysis of variant c.53 T > C(p. Leu18Pro) (red arrow) at DNA level (F) and cDNA level (G). From the DNA sequencing, it was evident that the proband sample showed double peaks (T and C) at this site, which indicates a heterozygous variant, whereas in cDNA sequencing, the proband sample showed a single peak of “C,” and the peak of “T” was not shown, which suggests that the cDNA strand of “T”(from the father) had not been transcribed. The sample from the mother showed the same double peaks, “T” and “C,” at this site in both DNA and cDNA sequencing, indicating that both DNA strands were transcribed. As the father has homozygous “T” at this site, only the single peak “T” was apparent in both DNA and cDNA sequencing.

Zebrafish chmp1a gene Leu18Pro mutation impairs cerebellum development. (A) Leu18 in human CHMP1A is conserved in species. The site of Leu18 among species is denoted by the red box. (B) Construction of chmp1a Leu18Pro point mutation zebrafish line by base editor. Schematic diagram (left) and sequencing results (right) of ZSpRY-ABE8e-induced chmp1a (Leu18Pro) heterozygous mutation. The protospacer adjacent motif (PAM) sequence is marked by the red box, the mutation information is marked by a yellow box, the detected nucleotide change base A is shown by upper case in the gRNA sequence, the nucleotide substitutions are indicated by a red arrowhead in the sequencing chromatograms. (C) Zebrafish chmp1a Leu18Pro point mutation impaired cerebellum development. Arrowheads indicate the cerebellum region in live embryo, ptfla, and reelin pictures; arrows in the ptfla picture show the lower rhombic lip (LRL). The percentage and numbers indicated in each picture are the ratio for the number (left in bracket) of affected embryos with a phenotype similar to what is shown in the picture and the total number (right in bracket) of observed embryos. The histogram represents the relative expression of the detected marker gene.

Acknowledgments
This image is the copyrighted work of the attributed author or publisher, and ZFIN has permission only to display this image to its users. Additional permissions should be obtained from the applicable author or publisher of the image. Full text @ Front Neurol