
- Title
-
Loss of Panx1 function in zebrafish alters motor behavior in a lab-on-chip model of Parkinson's disease
- Authors
- Khalili, A., Safarian, N., van Wijngaarden, E., Zoidl, G.S., Zoidl, G.R., Rezai, P.
- Source
- Full text @ J. Neurosci. Res.
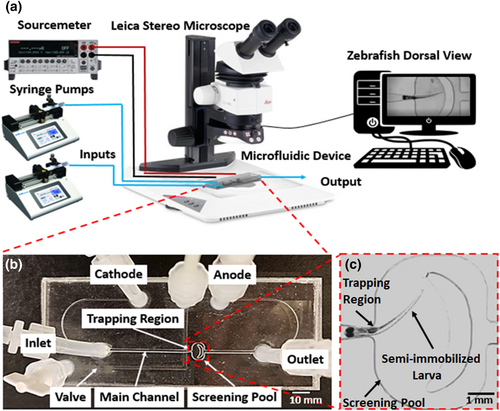
Microfluidic device and experimental setup for screening the electric-induced response of semi-immobilized 5-7dpf zebrafish larva. (a) The experimental setup made up of a microscope, two syringe pumps, a sourcemeter, computer, camera, and the microfluidic device connected via tubing and wires. (b) The device consists of a sloped inlet, rounded side channels, a main channel, trapping region (TR), screening pool, outlet, two electrodes, and valve channel. (c) Close-up view of the TR and screening pool showing a semi-immobilized 5dpf larva. |
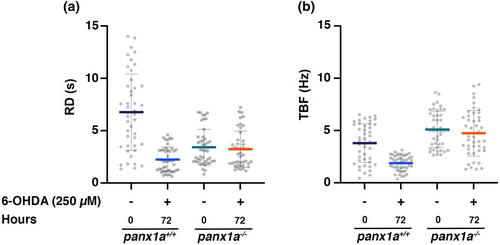
Electric-induced (a) RD and (b) TBF of 5dpf panx1a+/+ and panx1a−/− zebrafish larvae exposed to 250 μM 6-OHDA for 0 and 72 h. (15 larvae per experimental condition in three independent trials, N = 45). All data were compared with the panx1a+/+ control group. **p < .01, ***p < .001. |
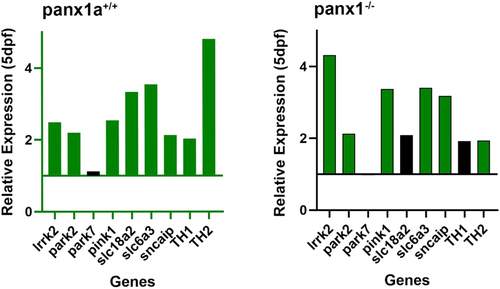
Differential expression of genes of the dopaminergic pathway in the 6-OHDA model at 5dpf. The bar charts show the relative expression ratios of nine genes quantified by RT-qPCR. We compared the expression of 6-OHDA-treated larvae to untreated siblings for both genotypes. Green bars represent statistically significant upregulations (p < .05). Statistical test: Relative Expression Software Tool (REST-2009) (Pfaffl, 2002). The number of experimental replicates (n = 3). |

Electric-induced (a) RD and (b) TBF of 7dpf panx1a+/+ and panx1a−/− zebrafish larvae exposed to 250 μM 6-OHDA for 0, 72 and 120 h (15 larvae per experimental condition in three independent trials, N = 45). All data were compared with the panx1a+/+ control group. *p < .05, **p < .01, ***p < .001. |
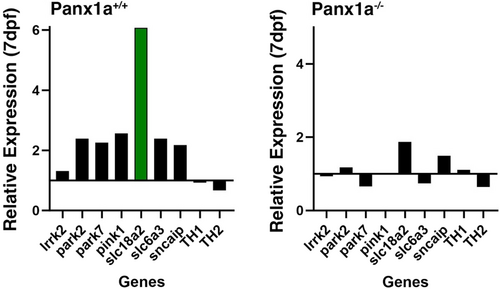
Differential expression of genes of the dopaminergic pathway in the 6-OHDA model at 7dpf. The bar charts show the relative expression ratios of nine genes quantified by RT-qPCR. We compared the expression of 6-OHDA-treated larvae to untreated siblings for both genotypes. The green bar represents a statistically significant upregulation (p < .05). Statistical test: Relative Expression Software Tool (REST-2009) (Pfaffl, 2002). Number of experimental replicates (n = 3). |