
- Title
-
Single-nuclei multiomic analyses identify human cardiac lymphatic endothelial cells associated with coronary arteries in the epicardium
- Authors
- Travisano, S.I., Harrison, M.R.M., Thornton, M.E., Grubbs, B.H., Quertermous, T., Lien, C.L.
- Source
- Full text @ Cell Rep.

snMultiomic analysis of human cardiac lymphatic vessels that are mainly associated with coronary arteries (A) Whole-mount dorsal view of 9PCW human fetal hearts immunostained for ACTA2 and N1ICD. The RCA (arrowhead) and the CXA (arrow) are marked (n = 3). (B and C) Whole-mount light sheet images of the 10.2PCW and 11PCW (C, bottom) dorsal views of human fetal hearts stained for smooth muscle marker ACTA2 (red) and endothelial cell marker VWF (green) (B) and LEC-expressing PROX1 (gray) (C). Magnified views (inset) show details of the RCA. Red arrowheads in (B): CA; green arrowheads in (B): CV. White arrowheads in (C) indicate the PROX1+ cell nuclei marking LECs associated with the ACTA2+ arteries on the ventricle (n = 15). PROX1+ nuclei (lymphatic) primarily align along the artery but also, rarely, with the vein. (D) Schematic of the workflow for isolation and enrichment of epicardium before the cell dissociation to perform the 10× snMultiome profiling. Ao, aorta; OFT, outflow tract. (E) UMAP of snRNA-seq data for all cells of the 10PCW heart showing several endothelial clusters. (E′) Pie chart showing percentage of all cell clusters from the snMultiome analyses. (F) UMAP of chromatin accessibility labeled as snATAC-seq. (G) UMAP of gene expression and chromatin accessibility computed using the WNN and labeled as snMultiome. Scale bars, 200 μm. |

Human cardiac LECs are associated with coronary arterial and epicardial cells that express VEGFC (A) Dot plots showing PROX1, FLT4, LYVE1, MRC1, PDPN, NRP2, and NRP1. All these markers, except for NRP1, co-exist in cluster 14 and are expressed in a mixed pattern in the other clusters. (B) Violin plots showing the distribution of PROX1, FLT4, LYVE1, MRC1, and PDPN in the dataset. (C) GO analyses of molecular function of cluster 14 identify VEGF activity and hyaluronic acid binding as main functions. (D) Immunostaining of PROX1 on the dorsal side of human heart ventricle showing tubular structure formation. (E) Whole-mount dorsal view of 10PCW human fetal hearts immunostained for PROX1 (green) and KDR (red) (below). Arrowheads indicate a region where PROX1+ cells are enriched in KDR expression (n = 3). (E′) The zoomed-in area (the dashed box) in (E). The dashed box indicates KDR expression in the CA (right) and high expression of KDR in LECs (left). (F) Immunohistochemistry for N1ICD (red), PROX1 (green), and ACTA2 (white) on 11PCW human heart transverse section shows PROX1+ cells surrounding the CA (white arrowheads) (n = 3). (G) Whole-mount dorsal view of 10PCW human fetal hearts immunostained for VEGFC (red) and ACTA2 (blue). (G′) The magnified view indicates a region (dashed box in G) where VEGFC is detected (white arrowheads), in close proximity to CA (n = 2). (H) Pseudobulk of the genome accessibility for the VEGFC locus for selected clusters (from top to bottom: cluster 0 for CM, clusters 1, 4, and 13 for SMC, cluster 10 for vein, cluster 14 for LECs, and cluster 17 for artery) from the snMultiome and the correlation coefficient between the accessibility of the peak and RNA expression of the gene showing positive correlation between the potential enhancers (white arrowheads) and the promoter of the VEGFC gene in artery. (I) FeaturePlots illustrating RNA expression levels from the WNN analysis of VEGFC (left) and CXCR4 (right) are high in arterial endothelium. Scale bars, 100 μm. |

Chromatin profiling of human cardiac LECs shows enriched binding motifs of ETS transcription factors (A) TF perturbations followed by expression (GO analysis) of the top 500 DEGs from LEC cluster predict an early ETV2 activation. (B) Volcano plot showing positive enrichment of motifs from LEC cluster 14. (C) FeaturePlots showing the motif enrichment for ETV2. (C′) Probability of Tn5 insertion across the genome centered around predicted ETV2 binding motif. The LEC cluster (cluster 14) and the macrophage cluster (group 19) have higher enrichment compared with the mesothelial cells (groups 7 and 23). (D) FeaturePlots illustrating RNA expression (top) from the WNN analysis of PROX1, NR2F2, SOX18, and RBPJ, and FeaturePlots showing the motif enrichment for PROX1, NR2F2, SOX18, and RBPJ (bottom). (E) Pseudobulk of the genome accessibility for the PROX1 locus for selected clusters from the multiome and the correlation coefficient between the accessibility of the peak and RNA expression of the gene showing positive correlation between the 5 kb enhancer and the promoter of the PROX1 gene. Red arrow: peak in cardiomyocytes; green arrow: peak in LECs and other PROX1+ ECs. (F) 12PCW fetal heart immunohistochemistry for MEF2 (red) and PROX1 co-staining (green) (n = 3); the magnified view shows co-staining of MEF2 and PROX1 in cardiomyocytes (white arrows) and PROX1 staining in epicardial LECs (arrowheads). Scale bars, 100 μm. |
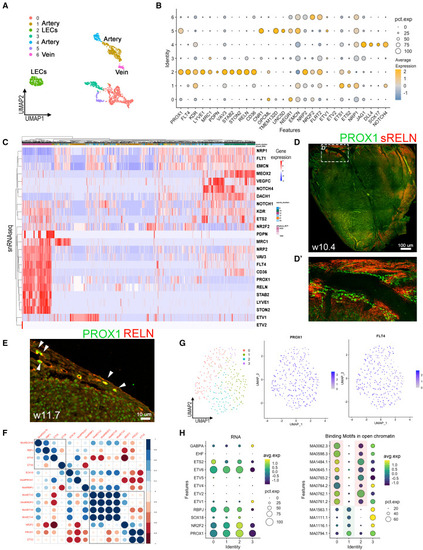
A bona fide population of cardiac LECs identified in human fetal heart (A) UMAP generated by EC subclusters of the cell dataset. (B) Dot plot showing both the expression level and the percentage of cells expressing selected genes from the EC clusters and lymphatic markers. (C) Heatmap generated from the EC clusters showing gene expression from snRNA-seq and genes defining the bona fide lymphatic cluster. (D) Whole-mount dorsal view z-projection of 10PCW human fetal hearts immunostained for PROX1 (green) and secreted forms of RELN (blue) and ETV2 (red) (n = 2). (D′) A magnified view of the region in the dashed box in (D). (E) Immunohistochemistry for RELN (red) and PROX1 (green) co-staining on 11PCW fetal heart sections showing signal of RELN surrounds LECs with high PROX1+ nuclei (white arrowheads) in the epicardium. (F) Spearman correlation plot for selected TFs’ average RNA expression and binding motif presence in open chromatin of endothelial and lymphatic cells. Color intensity of the circle indicates the strength of the correlation according to the scale provided at the side of the graph. (G) UMAP generated by subclustering the LECs from cluster 14 of the snMultiome in Figure 1G (left). FeaturePlots of snRNA-seq + snATAC-seq from the subclusters of the LECs showing different levels of expression of PROX1 and FLT4 RNA (right). (H) Dot plots illustrating RNA (left) and binding motifs (right). High-level expressions for PROX1, NR2F2, RBPJ, ETV6, and ETS2 are found in all 4 subclusters. However, binding motifs for all ETV family members show trends opposite to PROX1, NR2F2, SOX18, and RBPJ in the LEC subclusters. Scale bars, (D) 100 μm and (D′ and E) 10 μm. |
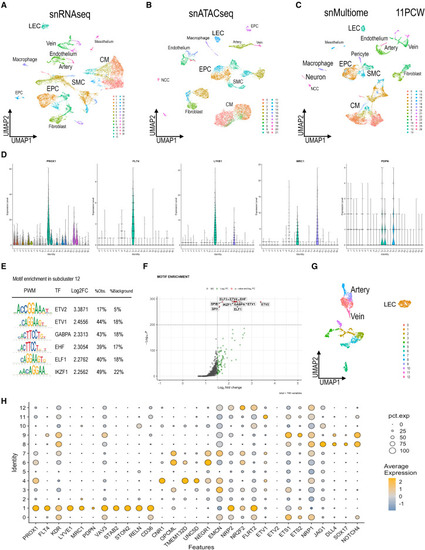
snMultiomic analyses of 11PCW (A) UMAP of snRNA-seq data for all cells of the 11PCW hearts showing several endothelial clusters. (B) UMAP of chromatin accessibility labeled as snATAC-seq at 11PCW. (C) UMAP of gene expression and chromatin accessibility computed using the WNN and labeled as snMultiome. (D) Violin plots showing distribution of PROX1, FLT4, LYVE1, MRC1, and PDPN from the 11PCW dataset. (E) Motif enrichment analysis showing positive enrichments of the top 6 position weight matrix (PWM) from the LEC cluster at 11PCW. (F) Volcano plot showing positive enrichments of the motifs from the LEC cluster. (G) UMAP generated by ECs subclusters of the 11PCW dataset. (H) Dot plot depicting both the expression level and the percentage of cells expressing selected genes from the EC clusters and lymphatic markers. |

|