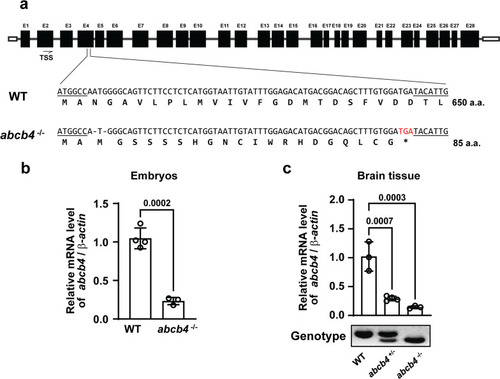
Generation of zebrafish abcb4 knockout mutant using CRISPER/Cas9 system a chematics of the abcb4 mutant alleles generated using CRISPER/Cas9. The 4th exon of abcb4 was targeted by gRNA. The sequences of the abcb4 wild-type (WT) and 2 nucleotides deletion mutant allele (abcb4−/−) were illustrated. Quantitative RT-PCR showed abcb4 transcript reduction in the embryos b and brain tissue c of the abcb4 mutant. Data are expressed as mean ± SD from at least three independent experiments. P-values were calculated using a two-tailed t-test or one-way ANOVA

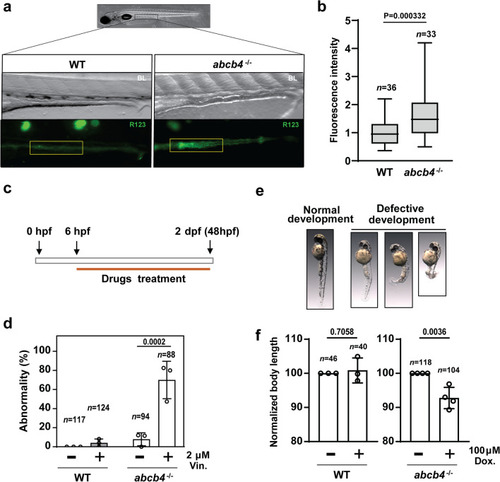
Zebrafish Abcb4 is an efflux transporter of rhodamine123, a substrate for human Pgp. a Fluorescence micrographs indicate the accumulation rhodamine123 in the WT and abcb4 knockout embryos. The intensity of rhodamine123 dye in WT and abcb4 knockout embryos was quantified and illustrated as a bar graph b. c Protocol of drug treatment for vinblastine and doxorubicin toxicity experiments. e Representative images of embryos with defects development after vinblastine treatment. d The percentage of embryos showing developmental abnormalities for WT and abcb4 mutant in the presence and absence of 2 μM vinblastine was compared by two-way ANOVA. eabcb4 knockout embryos treated with 100 µM doxorubicin demonstrate a reduction of body length in a two-tailed t-test. Data are expressed as mean ± SD from at least three independent experiments. n numbers indicate the total number of embryos across the independent experiments

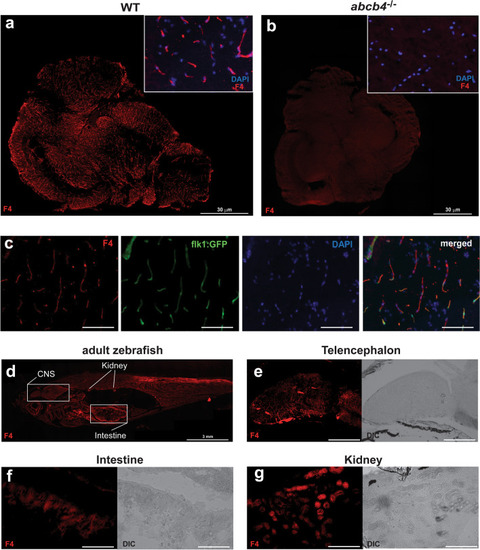
Zebrafish Abcb4 protein localizes to blood vessels in the zebrafish brain. Brain tissues of WT a and abcb4 knockout b adult zebrafish, as a negative control, were stained with anti-Pgp antibody F4 (red) as described in the Materials and Method section. Bar = 30 μm. c F4 antibody staining of whole adult zebrafish. Bar = 3 mm. Positive staining (red) was noted in the forebrain d, intestine e, and a subset of renal tubes or collecting ducts in the kidney f. g The F4 positive staining (red) in the brain colocalized with flk1:GFP positive cells (green). Fluorescence channels were interrogated individually and merged in. Nuclei were stained with DAPI (blue). Bar = 300 μm for (d, e), 200 μm for (f), and 50 μm for (g)

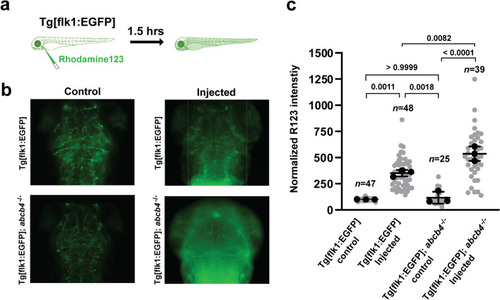
Efflux activity of zebrafish Abcb4 in the larval brain vasculature a Diagram of the intravascular injection of rhodamine123 experiment. Rhodamine123 (green) was injected into the cardinal vein of Tg[flk1:EGFP] and Tg[flk1:EGFP]; abcb4−/− embryos at 3 dpf and allowed to circulate for 1.5 h before imaging. b Representative images of the dorsal view of the larval brain after rhodamine123 injection showed the level of rhodamine123 accumulation in the brain area. c Quantification of normalized rhodamine123 intensity in the brain area of Tg[flk1:EGFP] and Tg[flk1:EGFP]; abcb4−/− embryos. Data are expressed as mean ± SD from three independent experiments (black dots). N numbers (gray dots) indicate the total number of embryos across the three independent experiments. P-values were calculated using two-way ANOVA

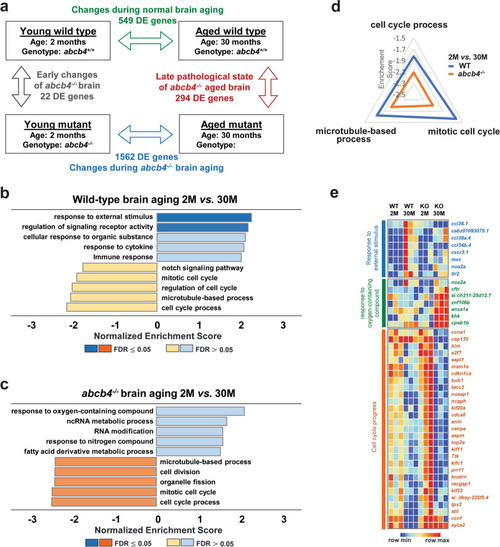
Age-related transcriptome profiling in abcb4 knockout zebrafish brain a Summary of significant DE genes from RNA-seq analysis of brain tissues between WT and abcb4 knockout zebrafish at 2 and 30 months. Gene Set Enrichment Analysis (GSEA) of age-associated DE genes (FDR < 0.5) in brain tissue of WT b and abcb4 mutant c (see Additional file 3 for detailed gene lists of GSEA). d Radial graph depicting the three enriched pathways more negatively regulated with age in abcb4-mutated brain than WT. e Heatmaps illustrate the relative level of transcripts in the enriched pathways from GSEA

Acknowledgments
This image is the copyrighted work of the attributed author or publisher, and ZFIN has permission only to display this image to its users. Additional permissions should be obtained from the applicable author or publisher of the image. Full text @ Hum. Genomics